“Hindsight is 20/20” is often an excuse for why a meltdown wasn’t seen. Yet, some people do see. People with foresight are better at asking “how does it work?” and “what if?”
In your last buy-sell decision, what did you discuss? Price trends? Analyst ratings? P/E? Fundamentals beyond earnings? Any forward-looking risks? If so, which types? In reviewing investor decisions that didn’t have good results, frequent findings are that few risks were considered, they were usually generic and not diverse – setting up failure.
Consider a few examples where too many people assumed…
- The Trump Administration fiscal and regulatory policy impacts will be like the Reagan Administration, missing that household debt is far higher so debt-fuel spending to boost GDP is much less likely. Demographic and technology changes further alter the comparison.
- An economic crater in the UK because the UK is smaller than the EU, missing that the UK is running a trade deficit with the EU and most all countries, and has far simpler negotiating dynamics – each giving the UK more leverage
- The Greek debt negotiation was the primary threat, allowing the migrant crisis to bubble with insufficient attention
- Federal Reserve quantitative easing (QE) would cause massive inflation, missing that the average of all goods prices had been falling since the mid-1990s, flowing from falling product costs across the “research-to-retail” value chain
- The U.S. bull market couldn’t continue based on history, missing that QE was new in history
- Fed QE would cause a “wealth effect”, missing that deleveraging, global dilution and demographics are far different today than during the Kennedy-Johnson years when theory of QE was considered for a “break glass” situation
- European Central Bank QE would cause inflation, missing falling prices in globally tradable goods, as in the U.S. and Japan
- Mortgage bond-based credit default swaps were solid investments, missing many warning signs
- S. housing prices were not in a bubble, missing price to income, debt level to income and other strained ratios
- Business cycles are cyclical or have the same causes, missing that data show significant differences in causes and timing of highs and lows
Yet, in each case there were people who knew because they bothered to look – they refused to accept the herd mentality.
Some people have more foresight than others simply because they avoid “structural blindness.” They ask, “what if?” More, these people know that asking “what if?” is useless if they don’t first ask “how does it really work?” As with basketball, it’s difficult to pick winners without knowing how the game is played.
Part 4 of our series on managing risk, “Cut your risk and boost your return – use the right ratios,” described how many risk measures suffer because they only look backward. Looking forward requires asking “what if?” – more formally, “scenario analysis.” There are many helpful guides to scenario analysis. To discover more, start with The Operational Risk Handbook and The Gray Rhino. Caution: Don’t make the mistake of fake scenarios such as “market drops 10%” or “CEO fired.” These are generic and don’t include causes that can be protected against. They give a false sense of security and set investors up for failure.
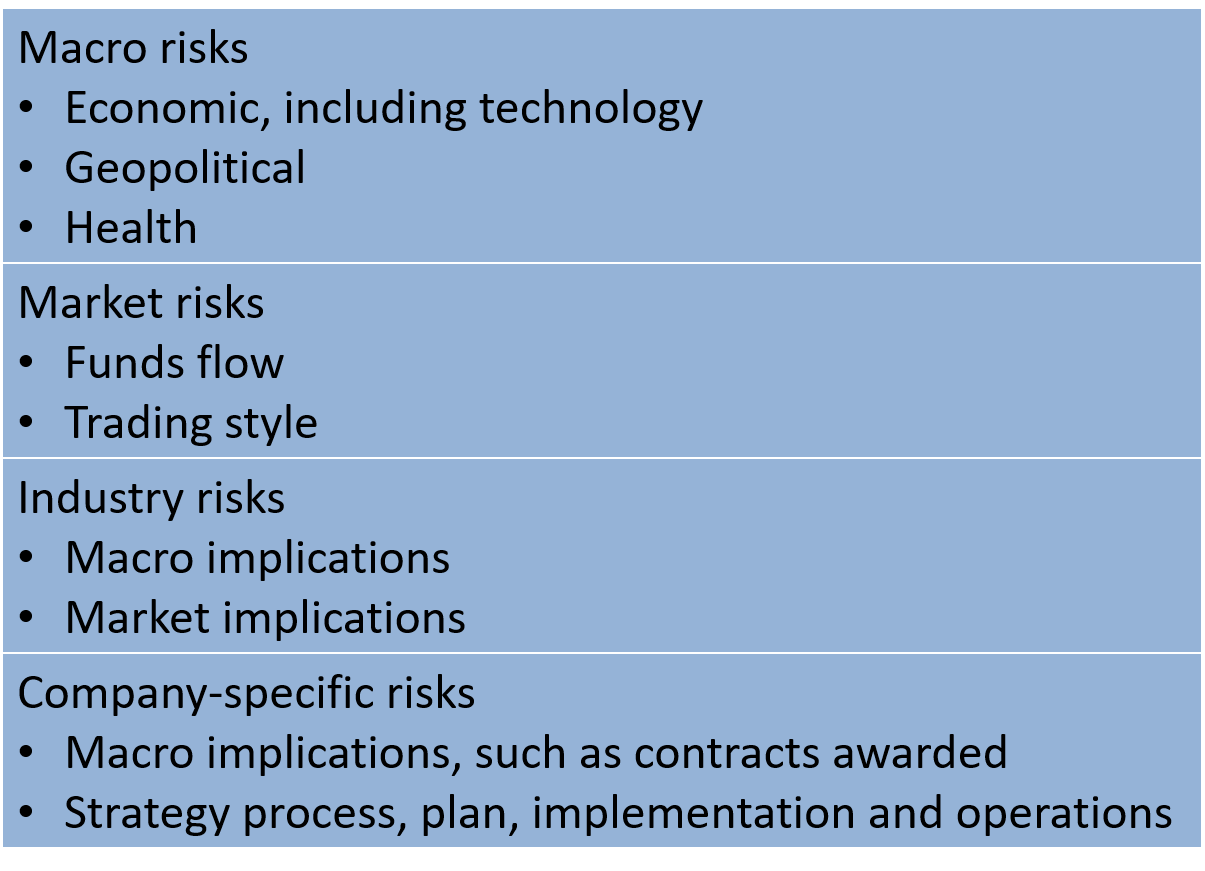
As risks are many and investors can quickly become overwhelmed, the most helpful step is often just to ask “what if?” for each of several groups of risks. This avoids being structurally blind to an entire group. Macroeconomic and geopolitical risks include:
- Interest rates (central bank rates and relative spreads to other rates) — impacts on savers and debtors
- Households — demographics, savings and costs
- Business — cash haves and have-nots
- Scarce resource (commodities and input goods) — differential impacts on prices
- Government — debt and policy
- Geopolitical
- Health/pandemic
For the S&P 500 in the post-WWII period, macro has been about 90% of market returns. The top macro drivers vary with time. Since about 1973, drivers mostly have been forms of debt. Thus, macro risk demands extra attention.
Macro risks mostly guide toward asset classes and countries.
Market risks include:
- Flow of funds (including debt) cascading through asset classes seeking risk-return combinations
- Liquidity in times of stress
- Interaction between markets — cash equity, index, fund, derivatives, debt and currency
- Trading patterns
Increasingly, funds flows are from emerging markets, either household wealth or cash from business earnings needing to be deployed. Of course, these flows interact with macroeconomic and geopolitical risks. When you are reading any proposed tax, spending, regulatory or monetary policy, look for funds flow impact.
Market risks mostly guide to countries and timing.
A privilege of the U.S. greenback and economic size is that U.S. markets tend to cause more ripples to the rest of the world than they receive. For example, U.S. markets during U.S. quantitative easing (QE) were only constrained by the disbelief of traders that markets could keep riding higher and suffered no significant corrections. By contrast, the Nikkei 225 suffered about a 25% drop from summer 2015 to summer 2016, even while the Bank of Japan was dramatically buying government securities.
Industry risks include:
- Any of the macro risks made specific to industries, such as interest rates on banks, or medical care or energy policy
- Any of the market risks made specific to industries, such as sector/industry rotations
Company risks include:
- All the external environment and internal risks related to strategy process, plan, implementation and operations
- Corporate governance
- Macro implications such as government policy for tax (cash moved across borders), spending (contracts received) or regulatory (mineral resource extraction operations expanded)
Trading twist
Macroeconomic and funds flows are historically reliable over time, but give little timing indication, especially when the strain gauge between markets and the tangible economic is historically high.
Historical fundamentals and analyst estimates don’t explain companies such as Nvidia with valuations that rest on exceptional management strategy and execution in markets of potentially large but uncertain size.
Here, investors are seeking sell signals beyond already strained fundamentals. This requires tools beyond fundamentals such as Technical Analysis and other trading expertise. Our editorial board members Mark Newton and Steve “Sarge” Guilfoyle are proficient in these methods, Mark for his expertise in Technical Analysis and Sarge for his long career as a top trader. Mark utilizes trend following techniques with overlays of sentiment and seasonality, while Sarge describes his approach as “simple technical analysis and pattern recognition, with a dash of guts mixed in.” These studies focus on price history, supply and demand, and how investors react to shifts in the balance and sentiment.
Different technical measures give different signals. For an investor new to technical analysis, a widely used indicator that has “stood the test of time” is the Moving Average Convergence Divergence indicator (MACD).
MACD is a momentum indicator created by subtracting a longer-term moving average from a shorter-term average, and then comparing this to the lagged moving average of the above. Plotted on a chart, an investor can see if the MACD is above or below the signal line which along with other tools, such as divergences, creates buy and sell signals, and is an indication of momentum. More information at StockCharts.com.
Bottom line:
- Robustly asking “how does it work?” and “what if?” gives investors an edge, but requires effort
- For investors with limited time, ask “what if?” for each group of risks to avoid blindness to an entire group.
- Question standard assumptions to find data and formulas that are long past their shelf life – as with risk calculations in earlier parts of this series. Failure to do so has led to some of the most spectacular meltdowns from the collapse of Long Term Capital Management in 1998 to the mortgage credit default swaps.
Be one of those people who see and understand warning signs by taking the time to ask “what if?”
Next time: Accepting past data and math assumptions have been the cause of too many implosions; thus, we’ll peek at a few such myths.
To learn more about how to apply these insights to your professional portfolio, business or policy initiative, contact “editor” at this URL.

