
Job loss warnings are scary — jobs being killed-off by technology without better jobs being created. Skeptics flag soft assumptions in job loss estimates. What people on both sides of the debate miss is the impact that already occurred.
Risk to a job is generally estimated based on the aspects of that job and technology available to replace humans doing the job.
Job aspects include:
- Changes in products made, such as digital camera sales falling once cameras were embedded in other electronics. Or, losses for repair services as products become more “throw-away.”
- Changes in job location, whether distant manufacturing or hyper-local manufacturing with 3D printers
- Changes in industrial process automation, including in stationary manufacturing plants, mobile cargo ships, and even floating processing platforms
- Changes in mobility due to tech (robotics) within a narrow location such as restaurant or construction site, or broader location such as highways. Remaining jobs could require less human intelligence where humans perform movements until it is more cost-effective to use tech.
- Changes in decision-making due to basic automation of business rules or more complex artificial intelligence (such as financial trading or medical diagnosis) – some remaining jobs could require more human intelligence (such as technology designers and implementers)
Technology aspects focus on the timing of when tech will replace humans:
- Availability – estimates are based mostly on technology in labs and exponential curves of improvement
- Adoption — difficult to estimate because of uncertainties in regulation, wage levels relative to technology cost, labor union contracts and consumer preferences
Skeptics are right to question the adoption estimates. However, their critiques often inappropriately:
- Include just mobility (robots) or process automation, without including decision-making tech (artificial intelligence) that is hurting higher-skill jobs
- Assume that jobs likely to be automated are lower-wage and thus not worth automating. This assumption overlooks long-falling costs and improving capabilities of technology. More broadly, it assumes history will continue despite the change around us.
What estimates have in common is that they build on U.S. Bureau of Labor Statistics (BLS) data. More research has been done in the U.S. than any other country because the BLS provides the most detailed data.
Investors and policy-makers too easily make mistakes in future of work evaluations
When evaluating data, they often don’t:
- Use the depth of BLS data
- Use BLS data along with U.S. Bureau of Economic Analysis data regarding changing product costs, as illustrated in “Secret to safer portfolios — know when the Fed is wrong”
When evaluating business decisions, they too often use outdated capital-labor substitution theory, rather than actual business cases used to make business decisions.
Thus, they fail to understand the causes of what they see in daily life and impacts it has already had on workers, investors/savers, and society. Thus, they make costly mistakes.
Avoiding evaluation failures with data
To help avoid failure, let’s peek at just one BLS raw data set – hours worked by industry. Hours worked data is more helpful than job counts data because job counts don’t differentiate between a person working one or sixty hours per week.
Below is percent change in hours worked from the mortgage debt meltdown (2009) to the most recent data (2015). Striking are the differences…
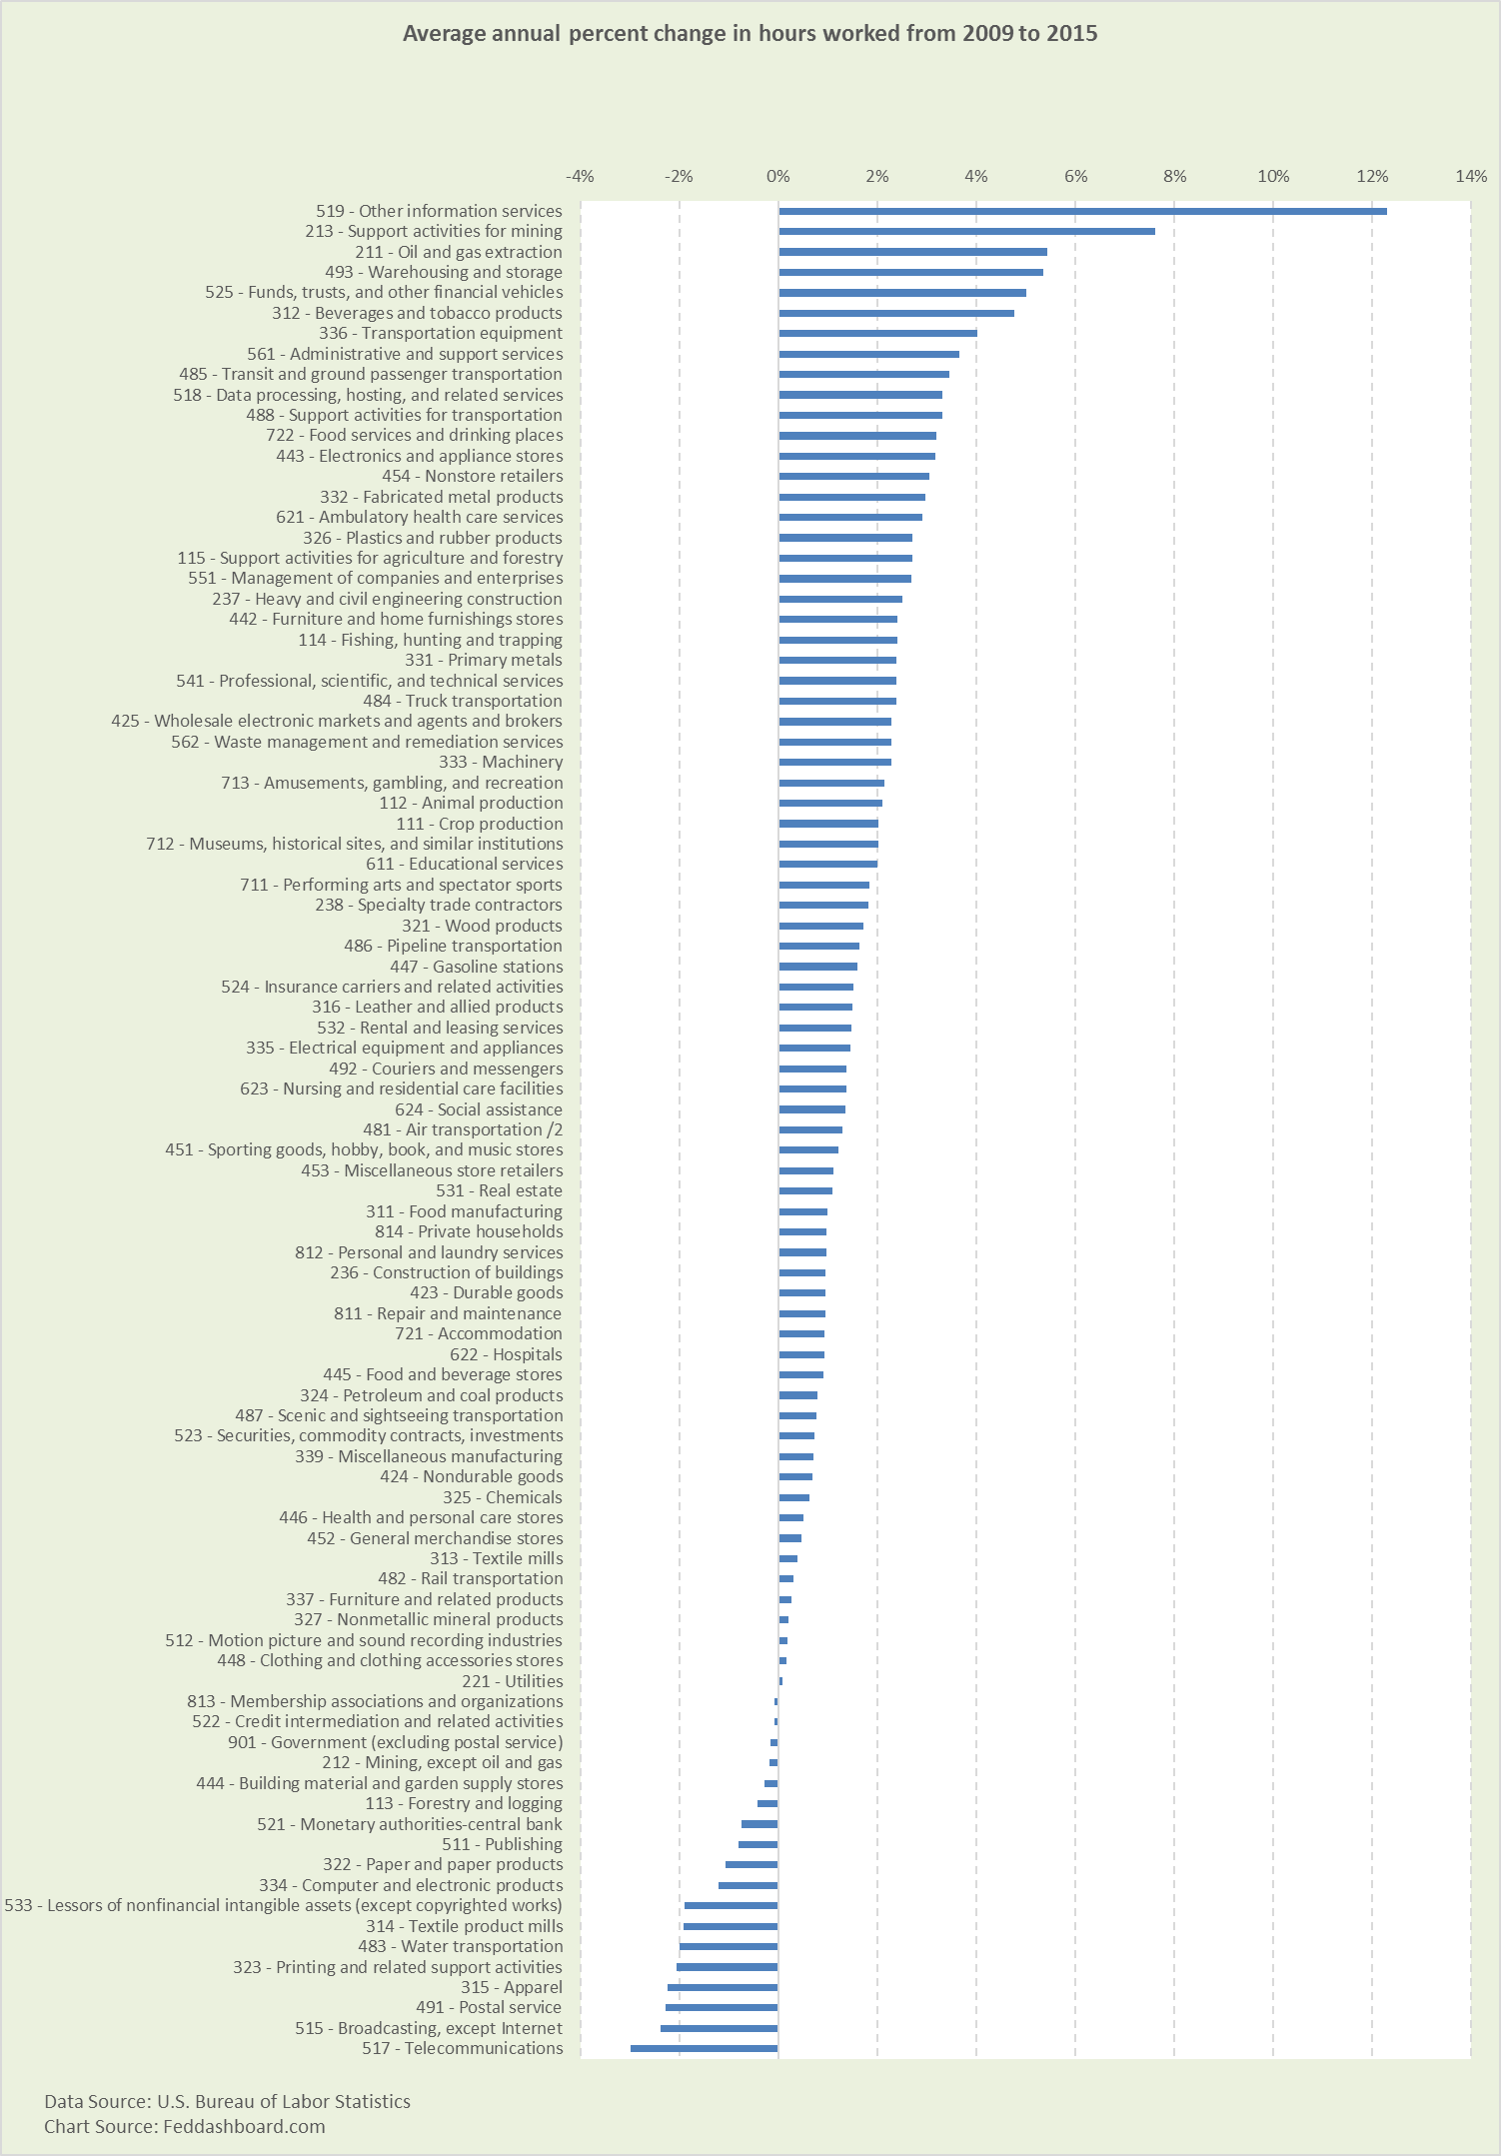 Highest growth is the “Other information services” industry that includes web search and content. Second highest is “Support activities for mining” because of both the rapid growth of oil & gas, and the increased use of outsourcing.
It’s long been known that the U.S. is shifting toward more services. But, most people don’t know what’s happening beneath and beyond the industry shift. For example…
- Service industry hours worked are growing, but not just generally, in specific ways. For example, jobs are switched from a manufacturing to a service industry when an advertising, legal or call center function is outsourced.
- Technology-related activities are growing, yet people are a relatively small contribution to output because the output is either scalable (like an app developed in a garage) or mostly driven by capital (such as “lights out” data centers).
- Oil and gas industry grew – with human-intensive surveying, well drilling and rig-building
- Online retail value chain is growing led by Amazon – as seen in warehousing, transportation, and nonstore retailers
- Transportation equipment is growing, led by motor vehicle bodies and trailers, and railroad cars
- Some industry hours are growing with consumer preferences (including millennial preferences), such as beverages, tobacco, and restaurants and bars
As you review the list, realize how many changes flow from technology, trade, and demographics (including health care).
Industry changes cascade into changes in measures such as labor productivity
Labor productivity is output (such as units shipped) divided by hours worked. As illustrated previously in “Fed is wrong on productivity; here’s how investors can profit from the data” and “Productivity puzzle explained — discover what happens when trends collide.”
The ongoing shift to services provided by people further lowers the labor productivity ratio. Labor productivity falls for two reasons:
- Hours worked in the denominator increase – much more than for services provided by technology
- Output in the numerator doesn’t increase as much because it is more difficult to measure improvement in the quality of human services than it is to measure improvements in a digital camera
Oil & gas growth drove up hours worked and cut labor productivity. Yet, once those rigs were operational, benefits started flowing from new-in-history cost-cutting that drove wellhead oil prices so low they surprised commodity traders and OPEC members.
Size matters
Growth rates are helpful, but they don’t tell the whole story. The plot below adds the 2015 number of hours worked.
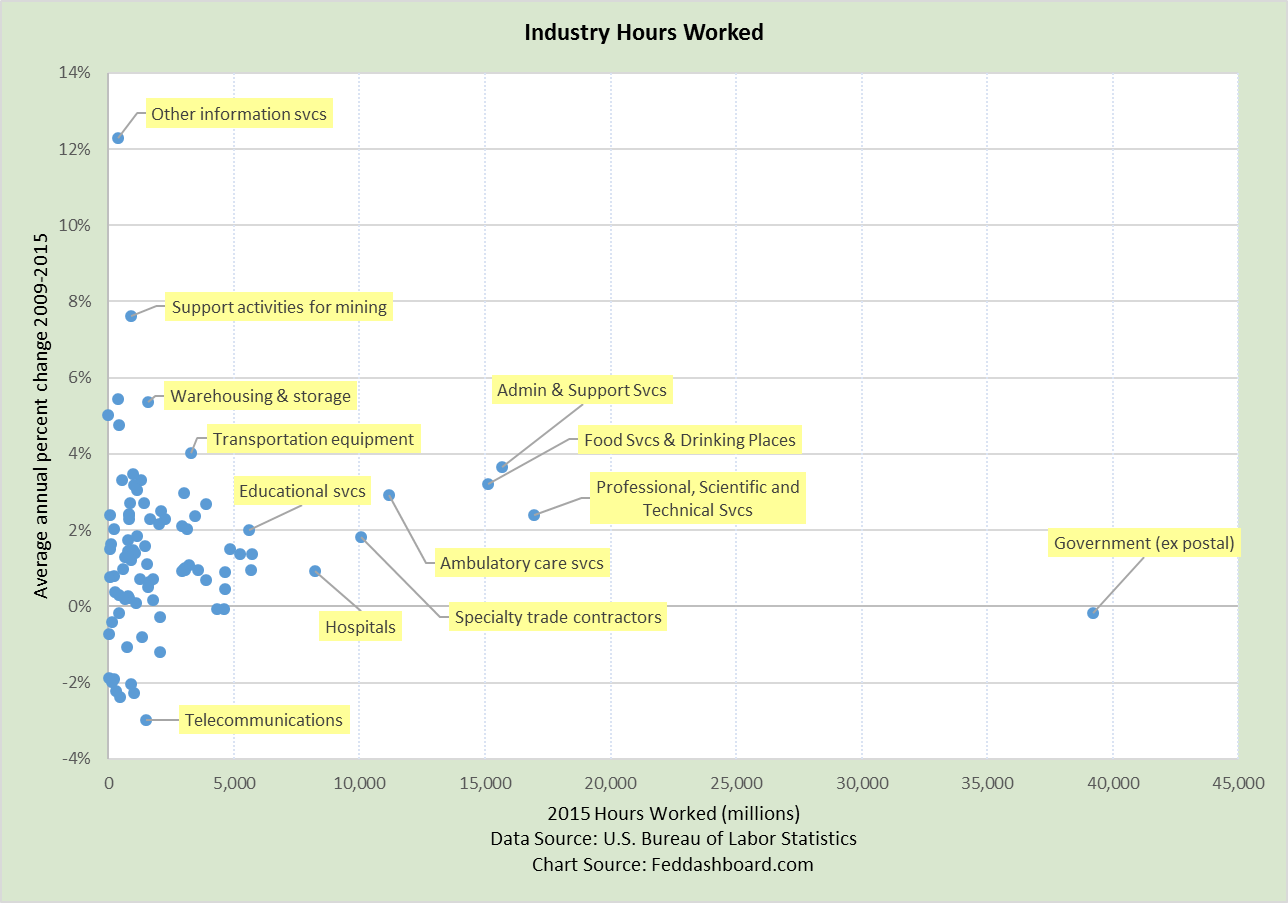 Stand-outs in size include business services, restaurants and bars, and ambulatory care. Ambulatory care reflects both demographics and a cost-saving shift from hospitals. Both ambulatory care and hospitals are seeing more use of tech to diagnose, and improve surgery and patient care (as in Japanese trials).
Striking is the number of industries reshaped by the tech and trade transformation.
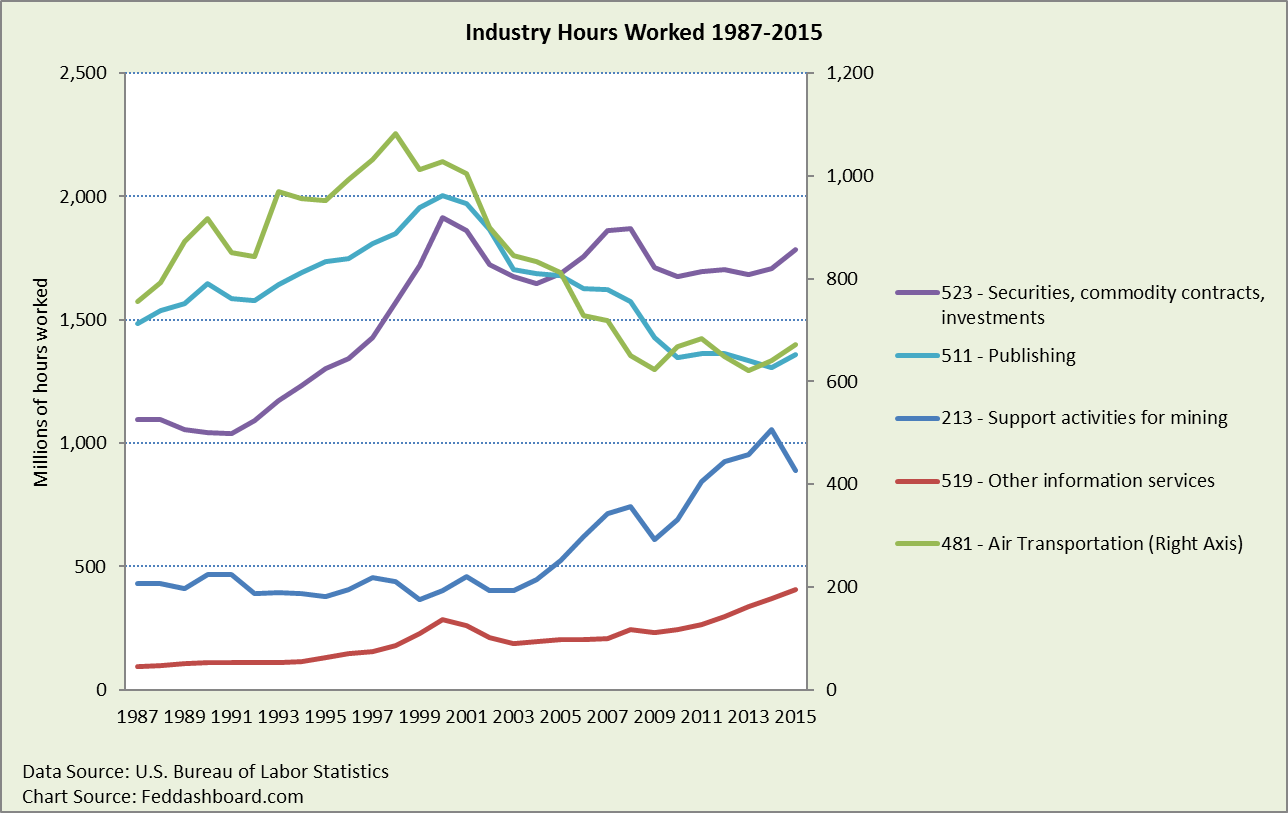
Industries shift over time
As averages hide answers, time reveals distinct patterns after both the dot com and housing bubble crashes. For all industries combined, average labor hours per person fell starting 1999. Since 2009, hours worked in other information services grew steadily. In support activities for mining, hours were slammed when oil price fell.
 The “future” of work already changed
Changes in job activities aren’t new. Tech appears new because tech is racing ahead at a nonlinear (exponential or power curve) pace, especially digital technology since the late 1960s. Tech has changed more than just productive equipment and logistics, it has also enabled better management practices. This lowered product costs across the “research-to-retail” value chain that then enabled two decades of falling goods prices as discussed in “Tech & trade – “must discuss” topics for Jackson Hole.”
For public policy, these impacts are far reaching in everything from trade to health care. For example, in health care, they suggest that a way out of our cost problems of demographics and improved palliative care is by doubling-down on tech. Further, it means that the jobs problem can’t be “fixed” just with proposals from past decades. Yes, regulatory reform and exports are necessary, but these don’t address the ripple effects of tech.
For investment evaluation, this suggests noticing how outsourcing means company fundamentals aren’t historically comparable. For investment selection, this suggests both riding growth trends and selecting companies that are successful consolidators in contracting industries.
The imperative is to deeply understand the dynamics of the tech and trade transformation.
To learn more about how to apply these insights to your professional portfolio, business or policy initiative, contact “editor” at this URL.
Data Geek Notes:
- Numbers on first chart are NAICS 3-digit industry codes.
- For industry details, including primary occupations, wages and more visit the BLS Industry at a Glance pages
- Job loss study examples include:
- Frey and Osborne. 2013. “The Future of Employment: How Susceptible Are Jobs to Computerisation?”
- McKinsey Global. 2015. “Four Fundamentals of Workplace Automation.”
- PWC, UK Economic Outlook, March 2017. “Will robots steal our jobs? The potential impact of automation on the UK and other major economies.”