
Again, Japanese shoppers bought more when prices fell — and cut purchases when prices rose. To grow more, babies per household matter more than purchases per household.
The latest estimate of 4Q2016 household consumption reports shoppers bought more durable goods as prices fell and fewer semi-durables and non-durables as those prices rose – the opposite of what the Bank of Japan (BoJ) expected.
The “textbook” price-quantity chart with each axis the same makes it easy to see the dramatic fall in consumer durable prices.
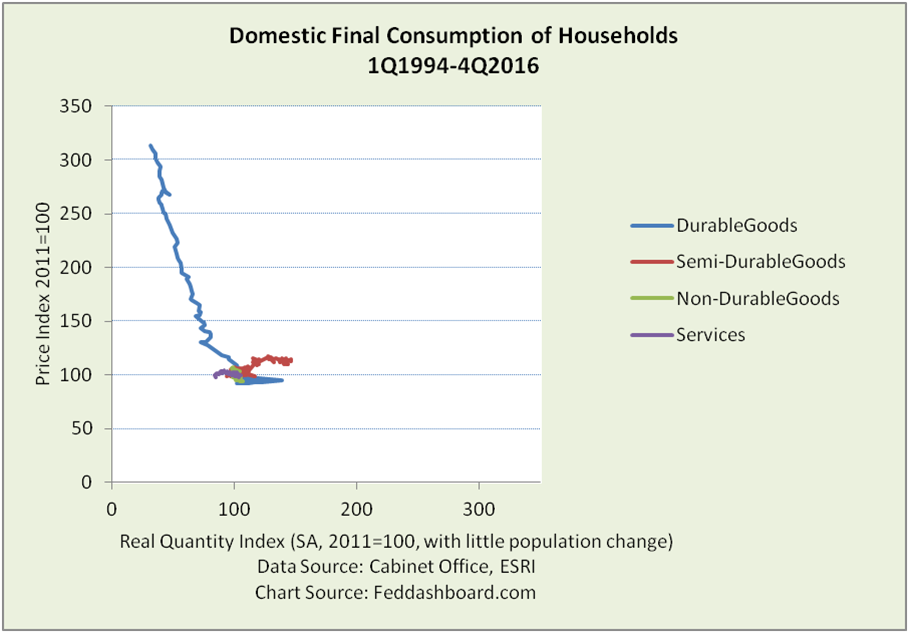 The dramatic price drop in consumer durables is especially notable as the global price drop in durables started with Japanese audio and video equipment in the mid-1970s. As we’ve discussed previously, over the past two decades, Japanese shoppers have been stronger buyers of durables than U.S. shoppers, although stronger in some years than others. More, Japanese consumers bought more while paying down debt from 1997 to 2012, while U.S. shoppers increased debt.
To see the other category indices more clearly, the chart below zooms in.
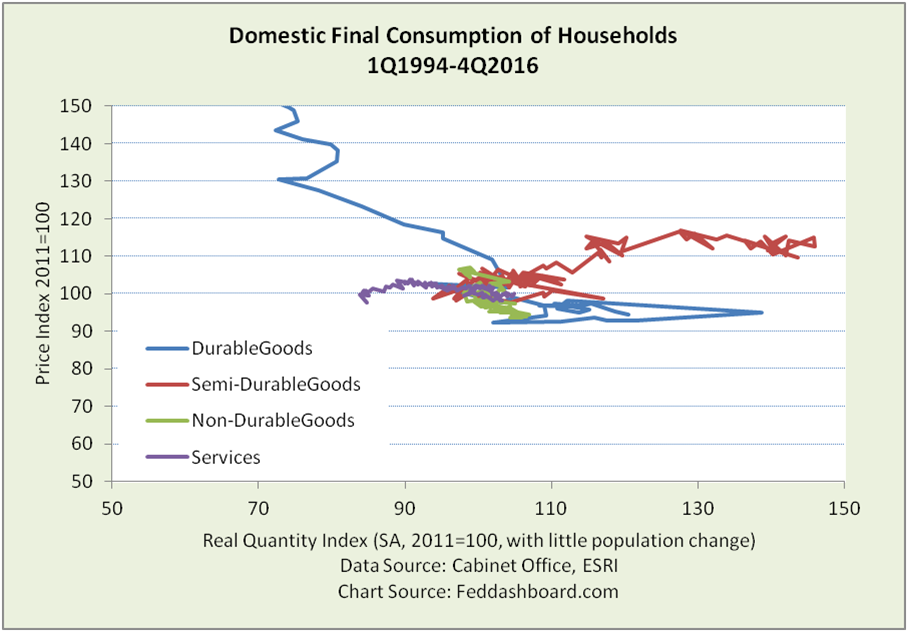 Durables grew at an average of 13% per year and services grew at an average of 1% per year (see Data Geek Note). The averages were stronger before the consumption tax increase in April 2014 and the BoJ’s quantitative easing (QE).
By contrast, semi-durables contracted hard before a small rebound to 1Q2014 and then fell back. Non-durables fluctuated more narrowly.
Combining the four purchase categories, purchases have been growing as illustrated in the zoomed-in picture below.
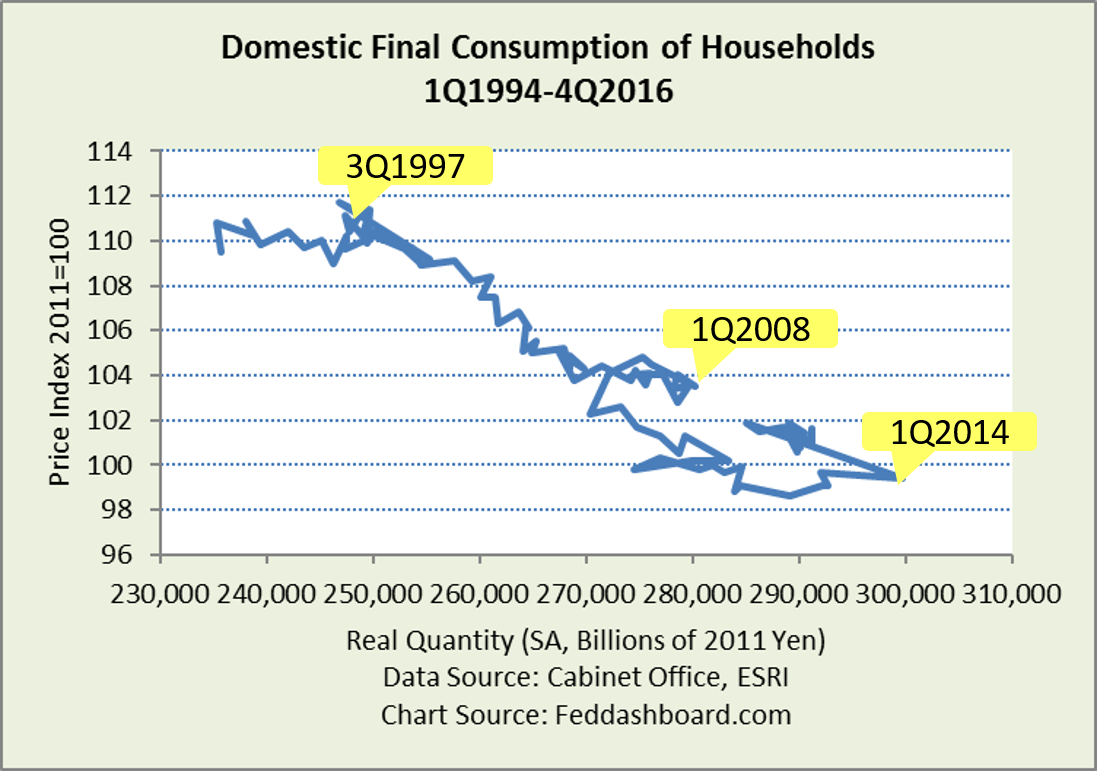 Notice the “fishhook” pattern. No goods category, nor the combined total, has recovered to its 4Q2013 level before the consumption tax increase and QE.
A simplified view of cumulative change is seen in the bar chart below. It starts in 1997 as that is when the average price of all household consumption began to fall and shoppers dramatically increased purchases of durables. The chart also compares the cumulative change from the update to the most recent System of National Accounts methods, recently implemented through the good work of Japan’s national accounting body the Economic and Social Research Institute (ESRI).
First, quantity purchased – the growth in durables was far greater than change in any other category.
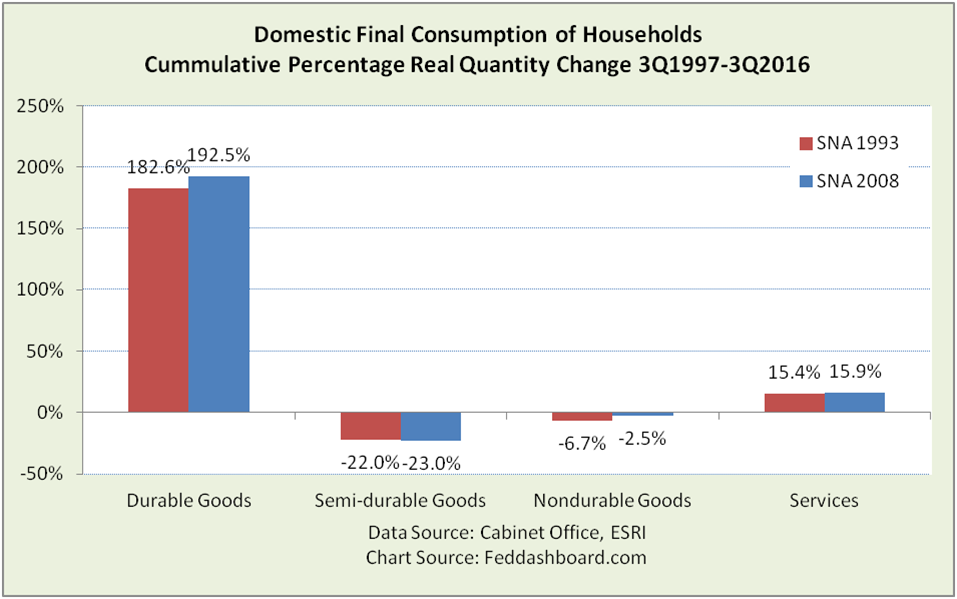 Second, price — the fall in durables prices is as dramatic as its increase in purchases.
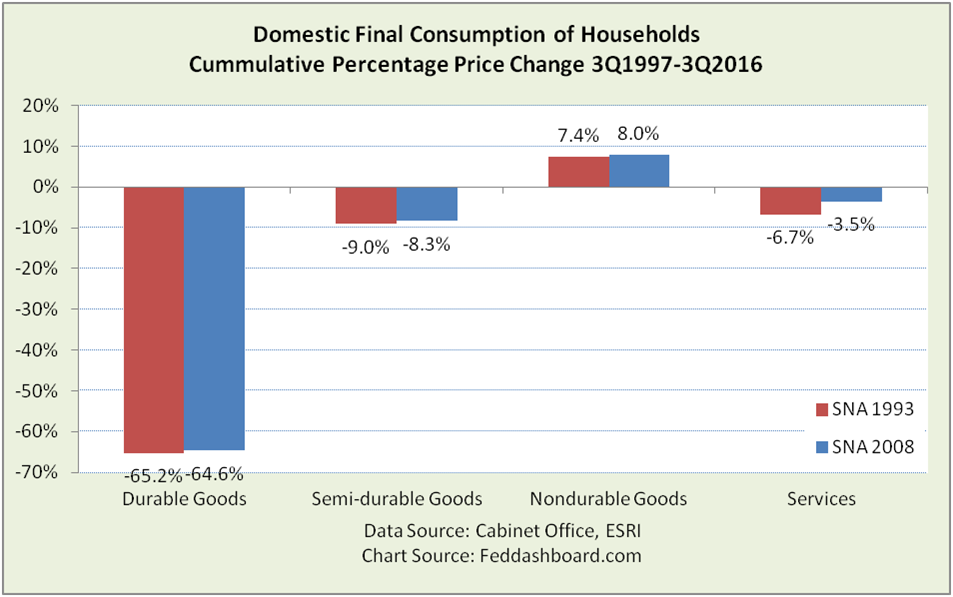 Notably, durables, nondurables, and services – over this period – all behaved inversely; shoppers bought more when prices fell. Oddly, semi-durables prices and quantity both cratered. What’s happening by category?
- Services as a category hides extremes. Scalable tradable services (think digital) are generally falling in price while purchases grow. Then, medical care and welfare services prices grew about 2.5% per year. Illness and age, more than discretion, drive medical purchases.
- Nondurables are mostly food and energy. Demographics mostly influence food. Energy efficiency, including mass transit, drives energy – plus mobility patterns that come with demographics.
- Semi-durables are heavily comprised of clothes and footwear. The National Survey of Family Income and Expenditure reports that from 1999 to 2014 shoppers cut clothes and footwear purchases by about 25% in real terms. Digging deeper reveals differences. Consumers cut traditional Japanese clothing purchases by 65%. They cut by nearly 50% purchases of children’s clothes and “cloth and thread.” “Other clothing” and footwear fell by only about 10%. Other semi-durables include bedding, recording media, games and toys and books – each has a story related to demographics or substitution with a durable good (such as a Sony Wii).
In sum, average overall shopping has been strong. Yes, clothing purchases cratered, but a need is for more babies – and maybe Japanese innovation in digital fashion.
Overall, data suggest that telling consumers “the economy is bad — buy more” is counter-productive.
- Population, not purchases per shopper, is the problem. Business behavior is another problem that Prime Minister Abe is addressing through structural reform and where investors can help.
- Using low real wage growth as an example of a weak economy is misleading. This is because real wages are nominal wages adjusted by the Consumer Price Index (CPI). The CPI overstates inflation compared to the price indices reported by ESRI, largely because consumer durables are undercounted. If the ESRI measures were used (as is done in the U.S. with data from the Bureau of Economic Analysis), then real personal income growth would be higher.
- Comparatively, the U.S. has also seen the average of all goods prices fall since the mid-1990s. But, U.S. “deflationary mindset” has been seen as a benefit to shoppers – not a problem. Differences include that U.S. 1) goods price decrease has been hidden by increases in health care, housing, higher education and other locally-provided, regulated services, 2) subsidy structures result in higher price levels, and 3) population is growing so national aggregates are growing.
- Negative message increases risk aversion. Fear both discourages couples from having babies and encourages savings – especially when interest rates fall — to achieve target retirement or safety savings.
Consumer reality running counter to BoJ expectations is not new. We’ve described this previously in “How Japanese shoppers surprised the BoJ – again.” A danger is that a consumer reality that runs counter to BoJ expectations could spread public distrust of financial institutions (other than the postal bank) to the BoJ and then Government. Currently high public trust in the Government is an advantage enjoyed by PM Abe, unlike any of his global peers.
Thanks to Brett Creech at the U.S. Bureau of Labor Statistics for his suggestion to use the Japanese Expenditure survey, see his recent “Beyond the Numbers” article.
Data Geek Notes:
- In the 2011 base year, on a real basis, nondurables were about 45% of services, semi-durables were 8.5% and durables were 13%
- 4Q2103 is used as a base because of the shopping spree of 1Q2014 before the April consumption tax increase
- Japanese clothes and footwear expenditures are adjusted for price change using the Japanese CPI for that category
- Consumers bought more services as prices rose, but service prices are a less reliable indicator as it is difficult to estimate real (price-adjusted and quality-improved) quantities of services, especially those personally-delivered
- For more on the 2011 benchmark update, see http://www.esri.cao.go.jp/en/sna/data/kakuhou/files/2015/pdf/point20161208_2e.pdf. For more on the JSNA 2008 conceptual and methodological changes, see http://www.esri.cao.go.jp/en/sna/data/kakuhou/files/2015/pdf/20160930_2008sna.pdf.