To find the most promising companies, look beyond earnings per share and price-to-earnings ratios. These are superficial and give you no advantage simply because everyone else is using them – especially frequent traders.
In 1907 Leo Baekeland heated a piece of wood to bake on a varnish. He failed. But he noticed ooze from the wood. His exploration of the ooze led to his invention of Bakelite – the first workable thermoplastic. Another chemist had discarded similar ooze because it didn’t crystallize. But crystallizing wasn’t the right measure of value.
For company value, as illustrated in “To find better measures of value, look beyond broadsheet relics,” price/earnings (P/E) ratios and earnings per share (EPS) are poor measures of value. Yet, EPS and P/E have survived in wide use because there is no simple alternative. This is because there are multiple good ways – business models – to create a valuable business.
Part 3 of our series on managing risk, “How far could price fall? Three ways to gauge stock drops.” concluded by asking how much of a price increase represents risk versus price supported by solid fundamentals. For example, chartists will see a steep price increase and flag an “ascending triangle” pattern.
In this Part 4, three stocks from our example portfolio are viewed through Zacks Research System (ZRS) charts. Visually, a valuation ratio that provides support for a price will create a relatively flat and stable line over time — because the numerator (price) and denominator (a fundamental measure) will balance out. “Fundamentals” include dozens of financial statement measures and ratios such as tangible book (common equity minus intangibles), sales, free cash flow, EPS growth rate or even earnings. A flat line means that if price increases, some fundamental is supporting that price growth.
Importantly, the fundamentals that matter most reflect business model. For example, in a software company, physical assets won’t rise with sales because software is a highly scalable business so sales can rise faster. Or, in a retailer, sales aren’t as important as cash flow because margins matter more. Of course, retailers divesting real estate reshape ratios. Liquidity ratios such as Current Ratio and Quick Ratio are insightful; just distinguish between piles of cash due to success versus underinvestment.
Example: Nvidia
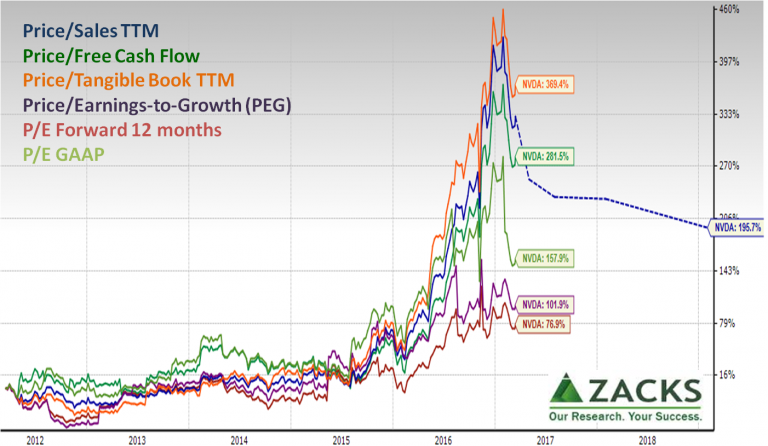
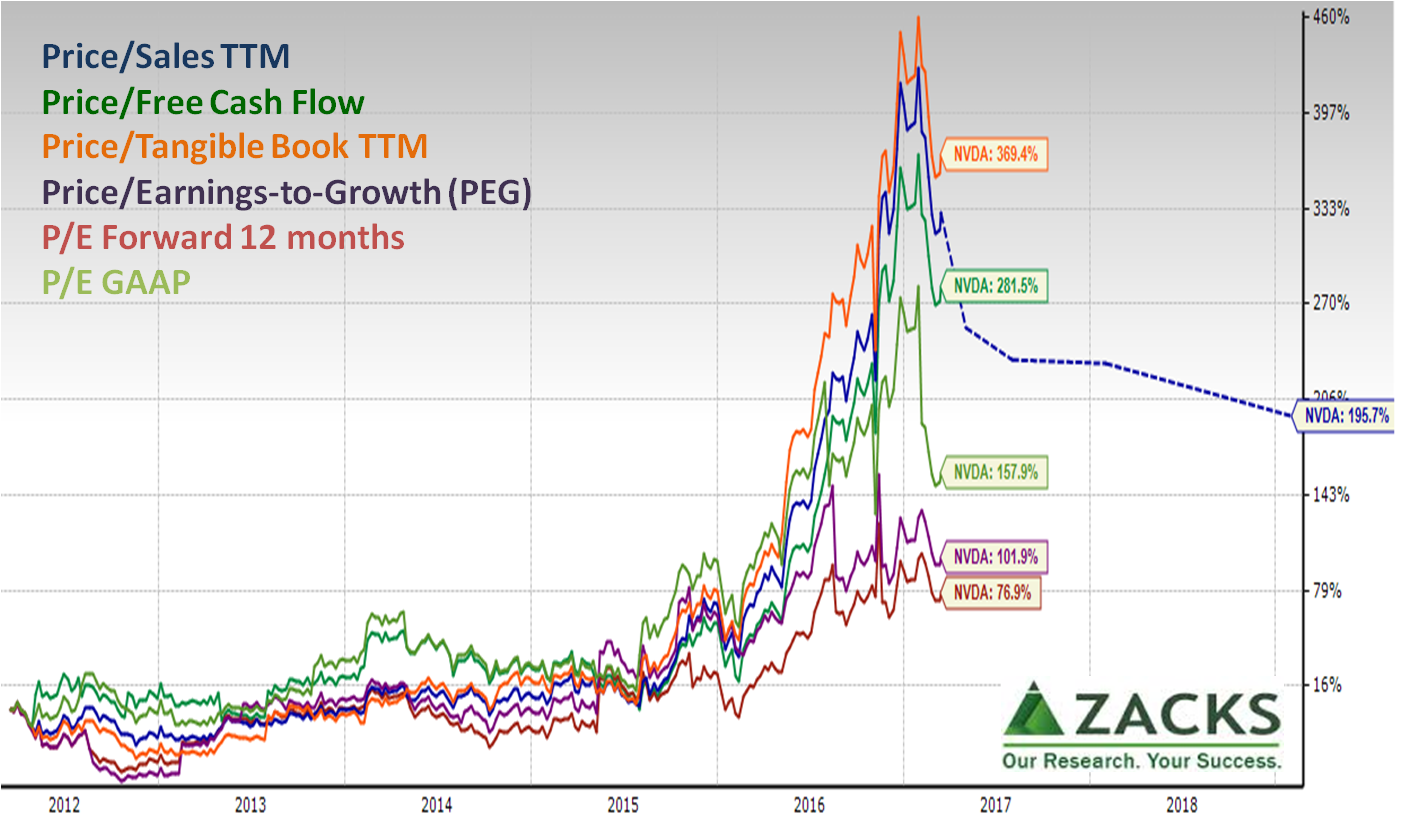
Nvidia rocketed to a roughly 330% price increase over the past year (over 600% over five years). What fundamental is supporting it? The price has not been justified by tangible book as that measure is sky high. By contrast, price is most supported by Zacks-surveyed analyst expectations of forward twelve month earnings. The P/E to growth ratio (PEG) being higher than forward P/E means expected growth in earnings isn’t expected to persist for five years by the five analysts who sent estimates to Zacks. Will the source of earnings growth be cost-cutting or sales? The falling expected price-to-sales (P/S) ratio (dotted line) indicates that sales growth will be a significant contributor, but far from not all.
 A better understanding of the ratios comes from drilling down on financials, company news and product analysis. For ZRS users, click “Financials” in the menu ribbon, then “Valuation Ratios” to see the specific numbers behind a chart. To decompose a ratio, within the “Financials” section, go to the relevant financial statement (e.g., Summary Standardized – Income Statement).
To visually decompose a ratio, use the “1-4 Panel” chart in the menu ribbon. For example, this picture decomposes the NVDA Price/Tangible Book (P/TB) ratio. NOTE: Carefully read vertical axes; ZRS maximizes visibility, not proportional change across panels.
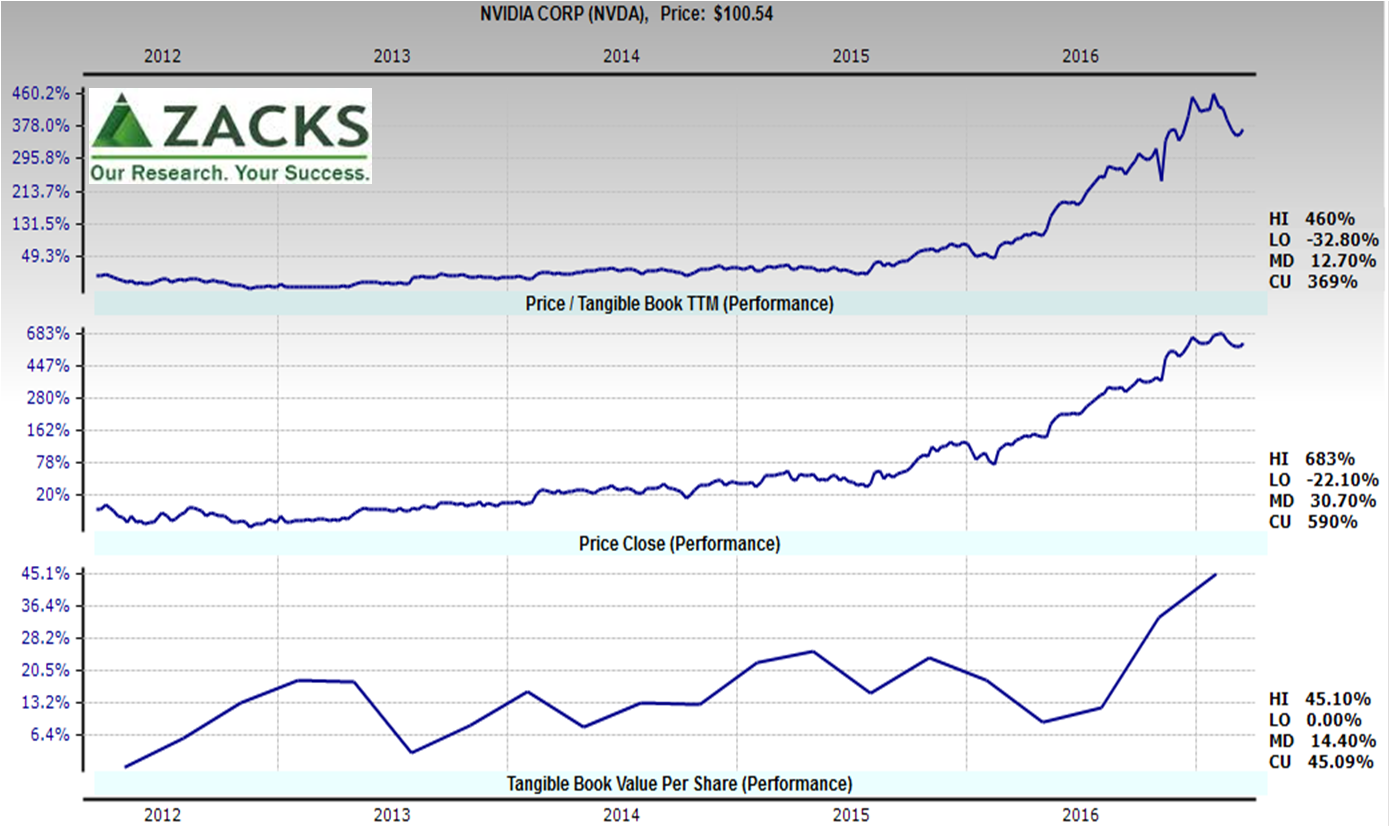 So what? Holding NVDA requires a deep understanding of the business, insight of strategy and ability to execute as typical fundamentals don’t justify the price. The most modest valuation ratio is forward P/E, so watch forward earnings like a hawk.
Since the high broke, traders hold sway until they sufficiently test a bottom. You can view a trader perspective by clicking the “Technicals>>” button in the ZRS Interactive Chart.
Example: Dow
Dow since mid-2013 has had fundamental ratios that are generally more horizontal. Here, the ratio that has grown most is the PEG – implying less support for price. By contrast, the forward P/E is relatively flat. As the PEG is the forward P/E divided by expected 3-5 year EPS growth, this means surveyed analysts don’t expect next year’s EPS growth to continue for 5 years. Yet, P/TB has been stable and lower showing tangible book rising via the Dow Corning silicones business acquisition.
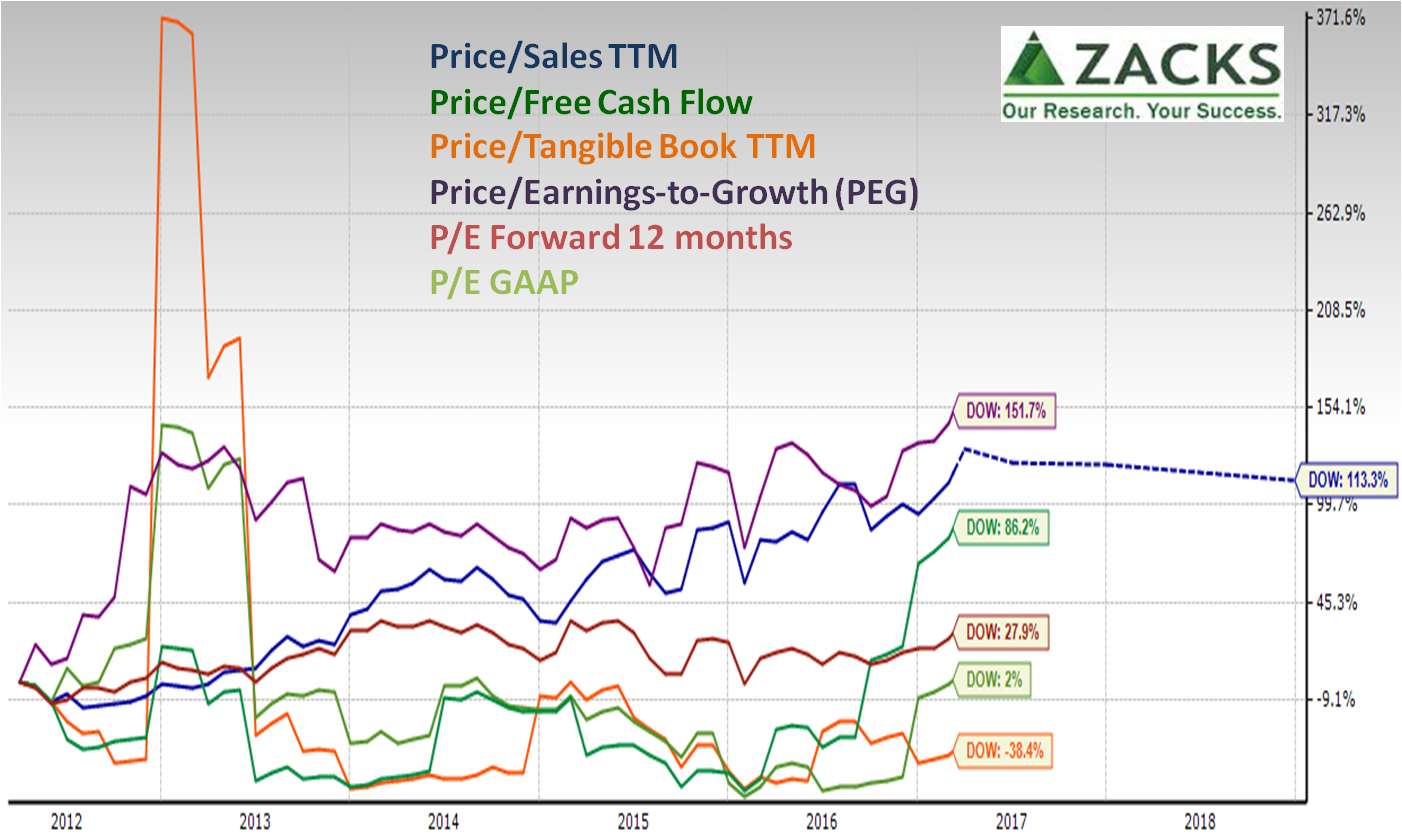 So what? Dow ratios need to be read with an eye to the June 2016 takeover of Dow Corning, how it handles real estate and pending merger with DuPont. Rising P/S and P/Free Cash Flow (FCF) are concerns. More notable is risk related to conditions of European Commission approval of the DuPont merger. This is “decision risk” discussed in “Fed’s bubble risk flags bigger danger you’re stuck with” and in the next part of this risk series.
Example: BP
The P/E GAAP has such a spike that showing it on the chart would make most other ratio lines indistinguishable. P/E (trailing twelve months and before nonrecurring items) is very high. P/E forward twelve months is more modest. BP is historically undervalued based on tangible book and sales. Free cash flow has suffered because while net cash from operations as fallen by about two-thirds since 2014, management has protected capital expenditures, cutting them only by about 25%.
In the Part 2 and Part 3 charts of min-max meltdown risk, BP has relatively little meltdown risk because it never road the Quantitative Easing bubble up. As it is near its low since 2010, it has even less meltdown risk than reflected in the min-max calculation, because the min-max calculation is without regard to trend.
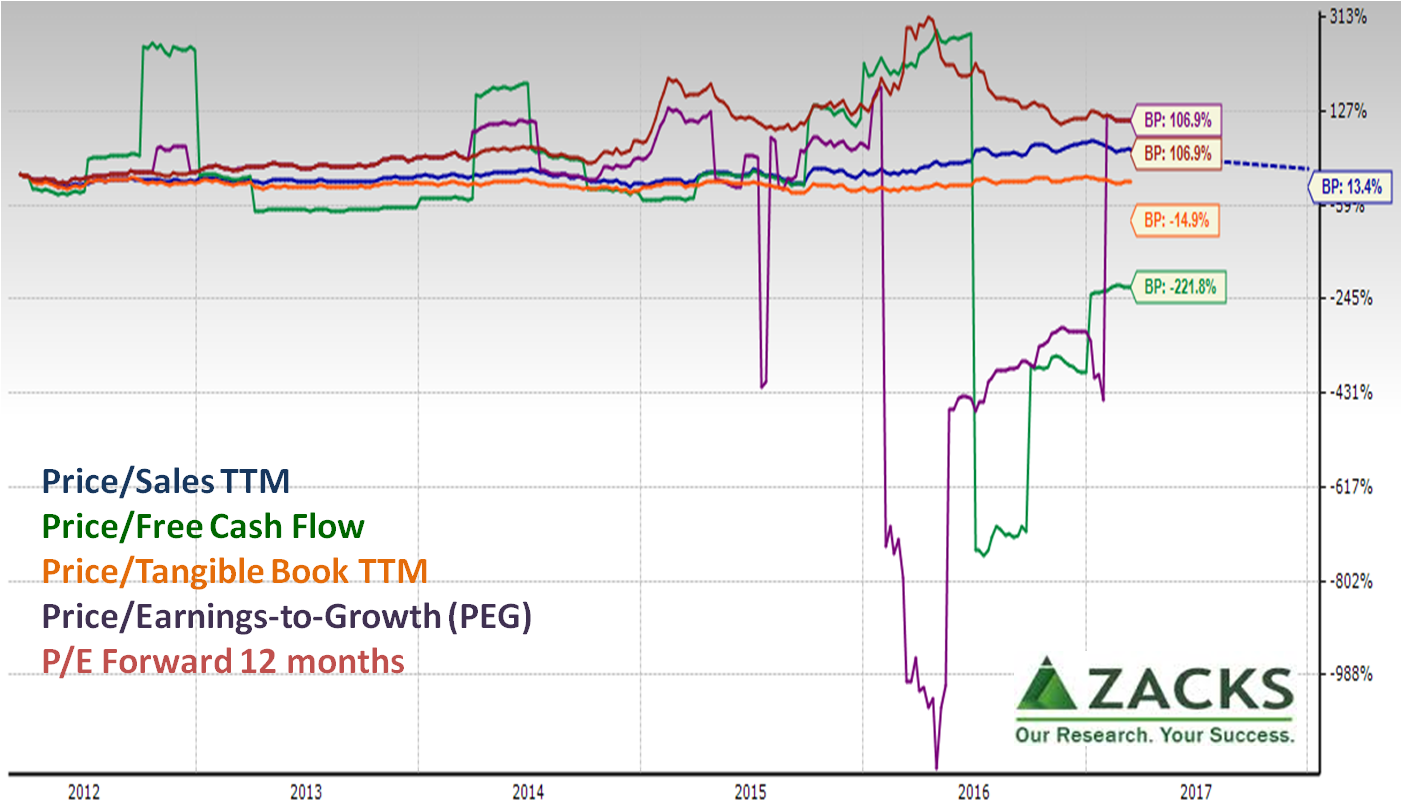 So what? BP is bought on a story of optimism or dividend yield. BP is also a good example of tailoring measures of risk. If an investor bought at a low price so is enjoying a high dividend yield and sees stronger cash flow from efficiency and higher oil prices, then BP’s a keeper.
Expanding evaluation for superior insight
For these examples, only a few ratios were used. Analysis becomes more powerful by including more ratios relevant to a business model — balance sheet ratios such as liquidity, capital structure-neutral measures of enterprise value and more.
The point – as always – is to spot healthy business models and avoid being drawn into a weak company with financial window-dressing.
In summary: More real value means less risk
This exploration of value ratios was not in pursuit of “undervalued” P/E or P/TB ratios. Rather, it was to go beyond our meltdown risk evaluation in “How far could price fall? Three ways to gauge stock drops.” The point of value ratios is to determine if the price-only risk measures overstate or understate risk.
Yet, value ratios suffer because they are mostly backward-looking and assume a company’s business environment is mostly unchanged. To get better, it’s easy to say “look forward,” but that is difficult to do. The forward view becomes easier and more insightful by asking, “what if?” in a more structured way. More thoughtfully asking “what if” also helps find more stable ratios that reflect enduring valuation propositions that create superior returns in business model-based investing.
Next time: Asking “what if?” for individual stocks, “the market” or macro events. For example, what if a skyrocketing stock blows up or the Fed bubble leaks? That’s our next investigation – click here to read “Two questions anyone can ask to gain better market foresight.”
To learn more about how to apply these insights to your professional portfolio, business or policy initiative, contact “editor” at this URL
Note: For more on Leo Baekeland and other innovators, read They Made America, by Harold Evans https://www.amazon.com/They-Made-America-Centuries-Innovators/dp/0316277665

