As U.S equities hit new bubble highs, it’s high time to avoid assuming that price or price/earnings ratios alone are sufficient to gauge bubbles. Investors are better served by comparing prices to more tangible value measures and global funds flows.
“…in the assessment of a few participants, equity prices were high when judged against standard valuation measures” is the most recent view from the Federal Open Market Committee. Surveying market news, most opinions are based on one of two adages. First, “that price is price” thus “no one can see a bubble, that’s why it’s called a ‘bubble.’” Second, a flavor of price/earnings ratio (also the Fed’s choice of “standard valuation measures”) is a stable view of “value.”
The problem is that neither adage is really true.
- Price isn’t autonomous; price has drivers – some harder and some softer (sentiment)
- Price/earnings ratio is flawed due to: weak historical data comparability, math and an investor (or corporate acquirer) does not receive earnings, as we’ve described in prior analyses.
Instead, investors can better evaluate price by turning to data for tangible comparisons (as used when buying an entire business) and funds flows.
Tangible comparisons
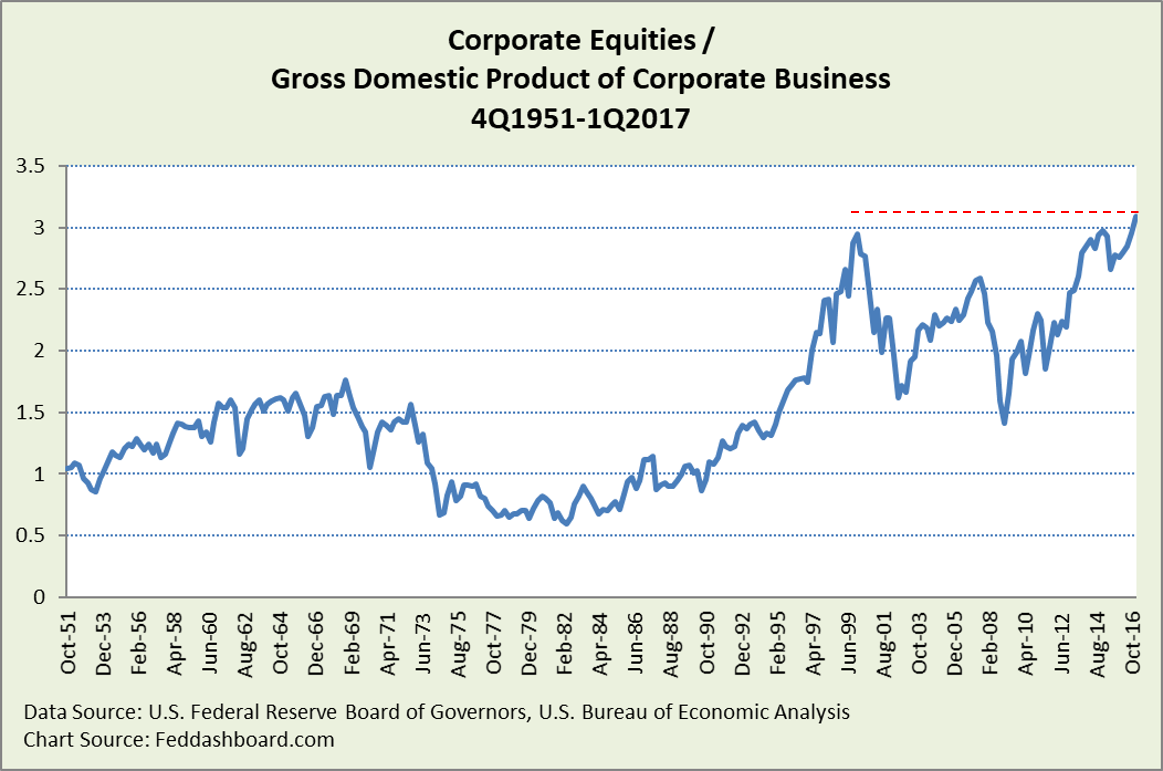
Like two kids with ice cream cones, “high” and “low” have little meaning until they can compare, as illustrated in our quick guide to spotting bubbles. When today’s equity prices are compared to tangible business Gross Domestic Product (GDP, also known as Gross Value Added, which is roughly sales adjusted for inventory) equity prices are straining at a record high.
 In a local community context, it doesn’t matter if a manufacturing plant’s earnings are better — if more people are out of work due to more outsourcing or robot automation, then the circular flow of our economy is damaged. “Top line” sales matter for economic growth.
Someone might say a manufacturer’s equity price is high because of an investor cash glut. “Cash glut” refers to global cash growing faster than GDP, mostly from quantitative easing (QE or Large-Scale Asset Purchases) and global wealthy. But, that cash glut:
- Won’t sustain the high valuation if another plant opens in capitalist fashion or if cash-rich investors shift industry or location preferences.
- Doesn’t justify high price, just explains why price was bid-up.
Funds flow comparisons
The monster funds flow since 2008 has been from central banks.
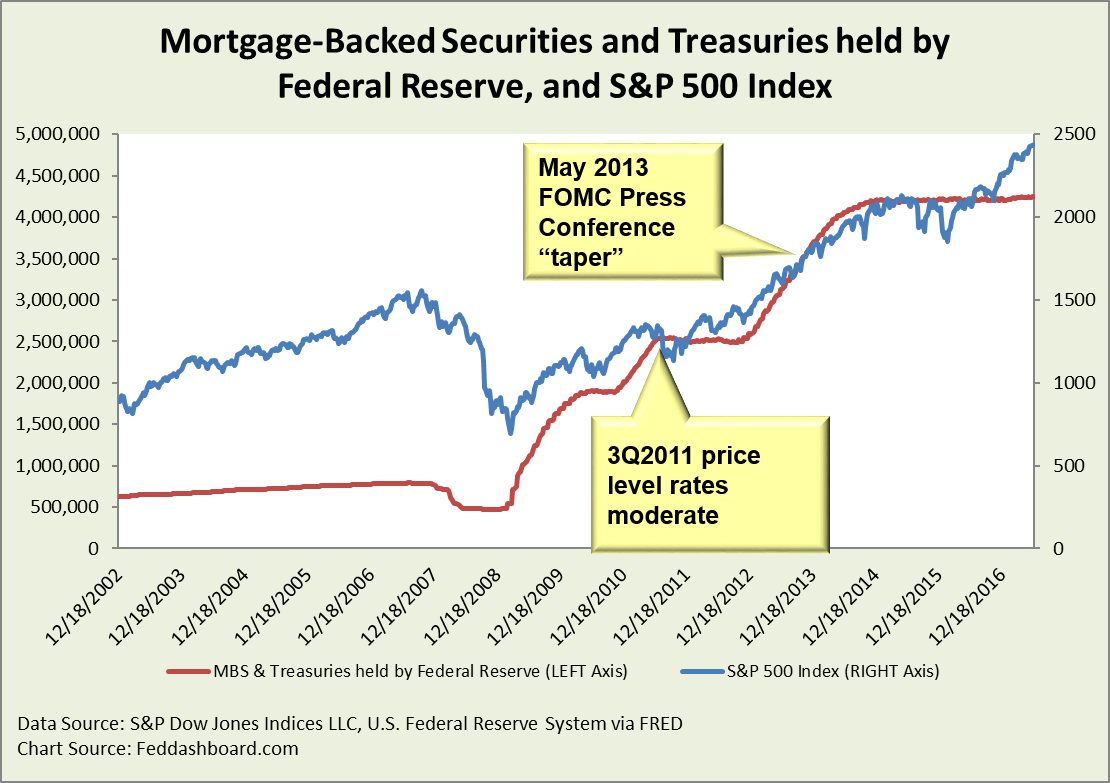
In the U.S. 2008-2015 QE period, 93% of equity gains were from QE.
 While shocking to many investors, this wasn’t a new dynamic. Since 1973, in each equity market era, over 90% of gains came from funds flow – usually debt, starting in 1973 with growth in consumer credit. More about debt in our series, “Don’t bet on business cycles.”
New about QE was it’s existence, the fast and tight tracking (especially early 2013 aided by a funds injection from the December 2012 tax effect), then traders tilting cautious after the May 2013 FOMC press conference and giving up gains they could have had by just “following the Fed,” and traders wrongly comparing the length of this recovery with prior recoveries that had no QE.
New since November 2016 is the growth in the S&P 500 (blue line above) beyond QE (red line). This has been mostly due to a mix of: speculation on fiscal and regulatory policy changes in Washington, increasing U.S. interest rates drawing global funds, and the growth of global cash available to come to the U.S. Of course, the Fed reducing its assets will be a new influence.
Bottom line:
- Investors are right to be alarmed by the historically high strain to tangible measures. But, before panicking, also evaluate funds flows to determine likely price direction.
- Investors can evaluate risk, especially drawdown risk, with insight from our series on risk management.
- In asset allocation, there’s a temptation to ride on the funds flow freeway. But, that’s risky. Private funds don’t have the same market volatility and tend to price closer to tangible fundamentals.
To learn more about how to apply these insights to your professional portfolio, business or policy initiative, contact “editor” at this URL.
Data Geek Note: To the extent that Business GDP is undercounted, the strain of prices over tangible value is less.

