
Contrary to usual views, Japan’s Potential GDP is higher than estimated because:
- Available labor hours are greater
- Labor is less of a constraint because, on average, relatively less labor is used to produce
- More output can be produced from any given Yen value of buildings and equipment
Estimates of Potential GDP differ in data selected, history included, and how trends are modeled. Estimates also have different assumptions about productivity and how increased resource use would change “inflation” (usually defined as average change of prices). These assumptions are problematic as we’ve shown previously with U.S. data in “Potential GDP is potentially misleading” and “How the Fed’s 2% target created their inflation trap and hurt our growth.”
To make it simple, let’s just look at available resources…
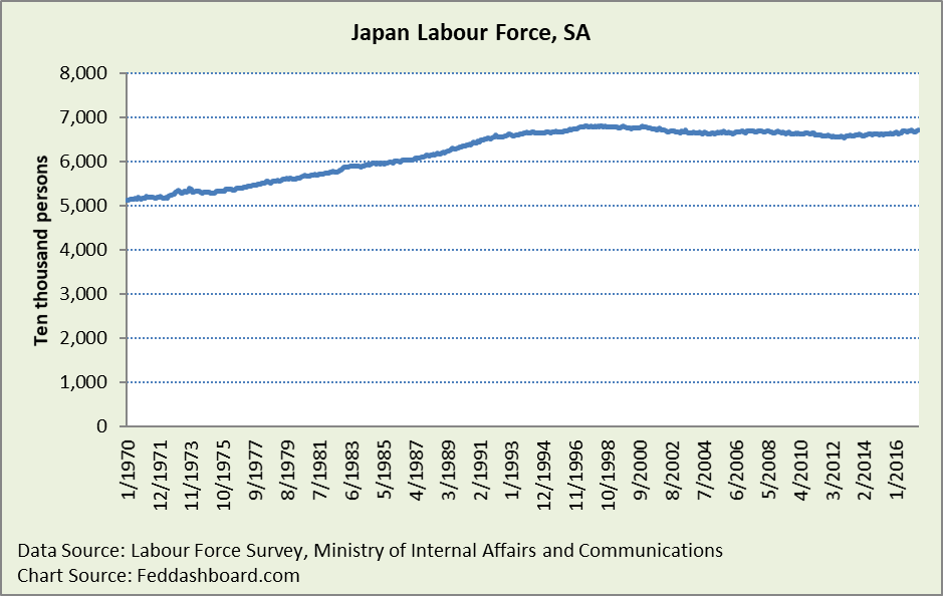
The usual view is that labor is scarce because of news about shortages in highly manual occupations like home delivery truck drivers or health care, and flat labor force.
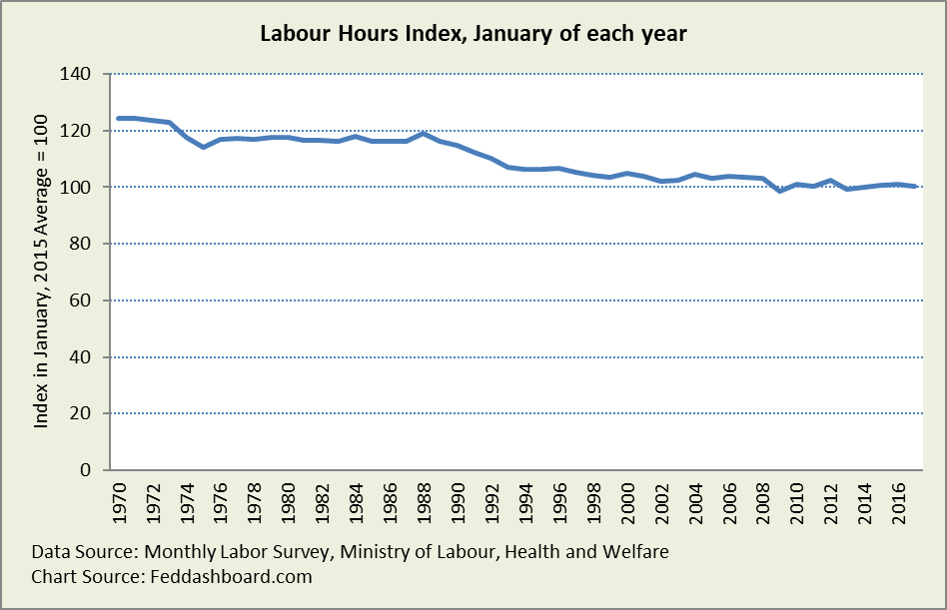
 But, this overlooks that average hours worked per worker have fallen about 20% since the early 1970s, like the U.S.
 Adjusted for Labor Force, average hours per worker fell by nearly 40% from 1970 to about 1997, roughly constant thereafter.
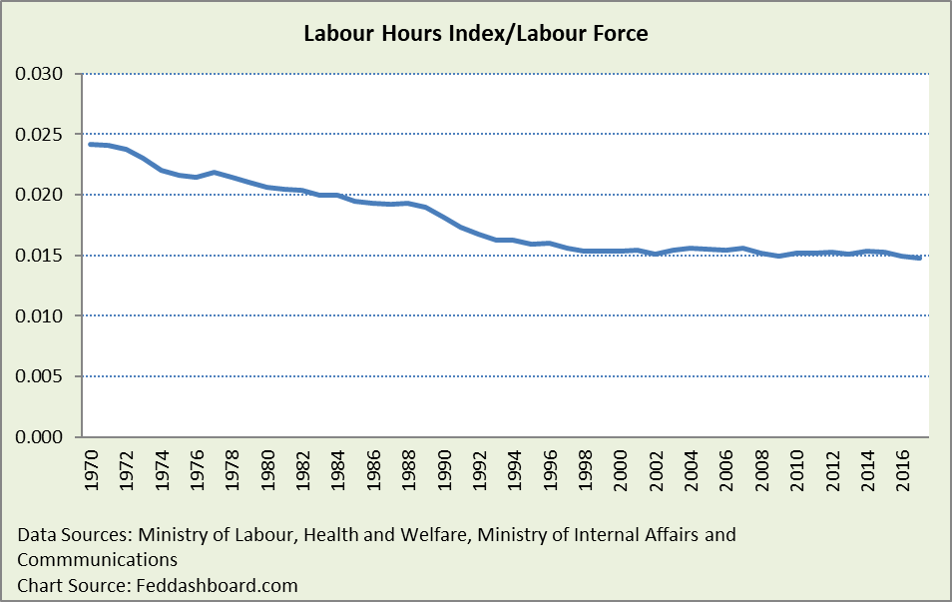 This decrease in average hours worked is also available resource to boost Potential GDP.
More importantly, the amount of labor used relative to physical capital has fallen over the years. This accompanied the “Japan, Inc.” innovations in management technique and technology that spread to the world.
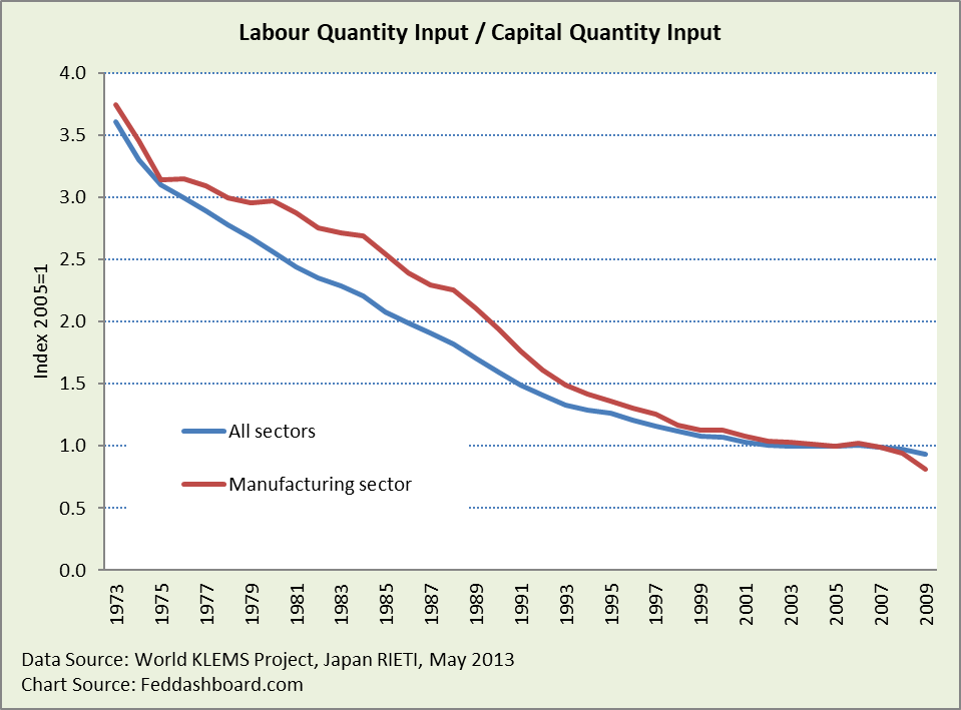 Thus, labor is more relatively more available over time and less used compared to capital. In both senses, labor is less of a constraint on production. Thus, formulas are outdated that emphasize labor as the primary constraint on growth.
If capital (termed Private Nonresidential Fixed Assets, PNRFA) has grown in importance, then how much has it grown? After a growth spurt from 1994-2000, from 2000 to 1Q2017 PNRFA grew only 4.4%. But, there’s more to the story…
First, output relative to PNRA grew over 10% since 1999 – meaning assets are more effective, a boost to Potential GDP.

Second, PNRFA is an aggregate average. Some assets are specific-purpose such as defense or transportation. Tech-related assets are difficult to consistently value over time because of rapid change. So, we highlight two assets — buildings and non-ICT equipment.
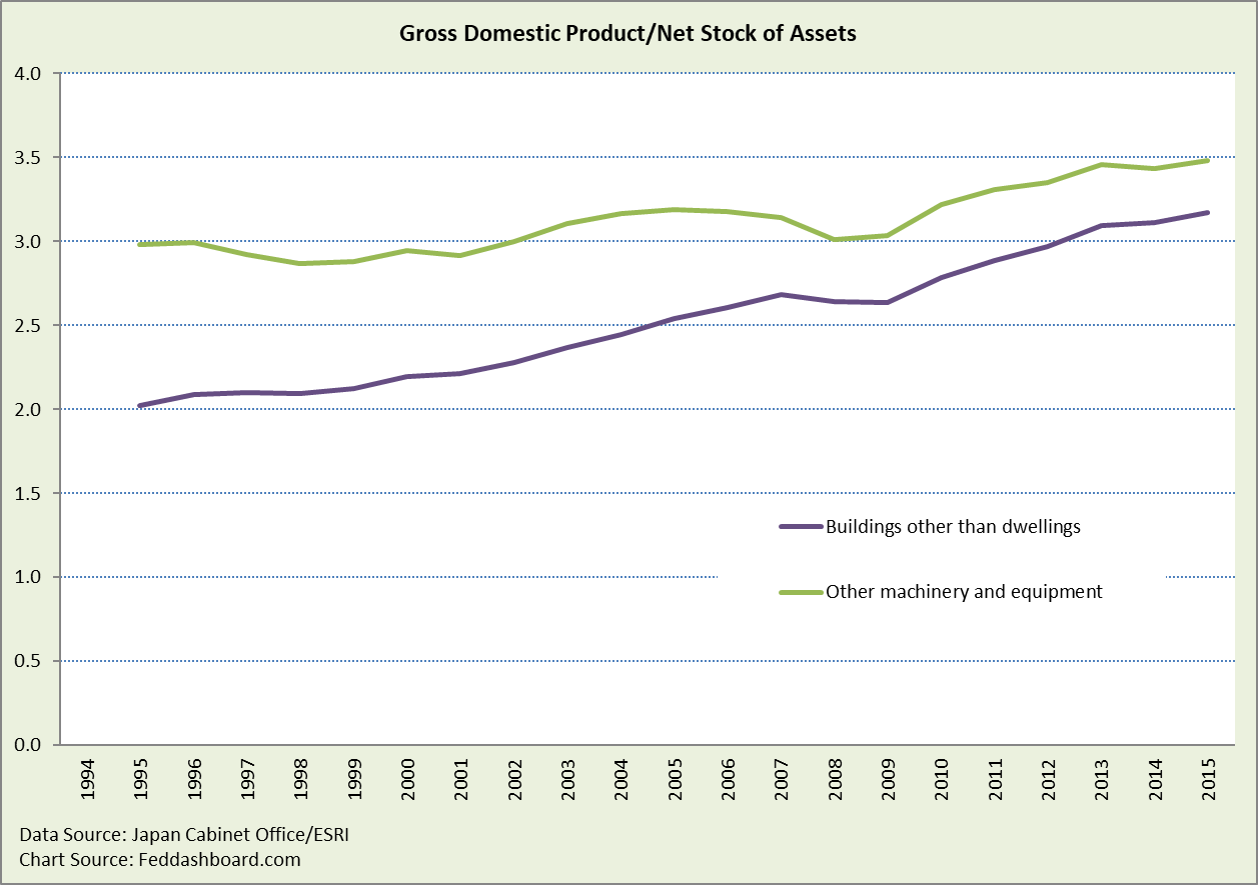
Since 1995, output from Buildings other than dwellings grew 57% and Other machinery and equipment grew by 17% — more benefit for Potential GDP.
Third, there is a difference between productive capability of buildings or equipment, and the monetary value of those assets.
- For equipment, accounting adjustments attempt to reflect improved capability or “quality.” But, the general sense is that improvements are undercounted. The more that capability (or quality) is undercounted, the higher the output relative to monetary value and the greater is GDP/net stock.
- For all assets, depreciation estimates matter. To the extent estimates are too high, net stock remaining is lower and GDP/net stock is higher. If depreciation rate is too low, then net stock remaining is higher, and GDP/net stock is lower.
- Management technique matters. Japan is the home of methods advocated by W. Edwards Deming and those who followed him. For example, if a manager rearranges a factory floor to produce more output, this doesn’t really change the real estate value. More, output improvements are often difficult to track in national accounting, but easily seen in company studies. Prime Minister Abe’s structural reforms seek to spread these improvements beyond the export-related industries where they are famous (e.g., autos or consumer electronics).
To learn more about how to apply these insights to your professional portfolio, business or policy initiative, contact “editor” at this URL.
Data Geek Notes:
- Different organizations use different formulas to produce different estimates of Potential GDP. In Japan, these include the Economic and Social Research Institute and the Bank of Japan. It’s also estimated by international organizations, such as the OECD.
- Labor services/capital services ratios calculated from different indices are significantly different. Here, World KLEMS Project indices are used for global comparability. Japan’s RIETI published three more years of data in which the ratio is flat.
- GDP/net stock was derived by dividing real values of each time series