The wrong view of Japan’s economy is stagnation. Data describe a different, more vibrant story:
- Tech, business efficiency, and structural reforms tend to lower costs and prices, despite Quantitative Easing (QE)
- Shoppers tend to buy more when prices fall, especially strong in durables
Japan’s exporters built efficient conversion engines for turning imported raw materials into valuable exports.
Structural reforms, free trade agreements, and babies matter far more than QE
Thus, Investors would be well-served to 1) revise macro model inputs to reflect data, not outdated theory and 2) seek companies taking advantage of tech, trade, and change
Removing Noise – Price pressures aren’t so strong
Japan’s 2Q2017 GDP and consumption data (first preliminary estimate) were released by the Cabinet Office. Before seasonal adjustment, the Household Consumption deflator rose an annualized 2.8%. But, after seasonal adjustment, it fell 0.4%.
Reading carefully, the second quarter price change (not seasonally adjusted) has been decreasing since 2Q2014. Second quarter 2014 was both the increase in value added tax to 8% from 5% and the first anniversary the Bank of Japan’s massive QE increase.
 The percent price change trend fell from 2014 to 2017. The primary exception in the recent data is the durables increase. Why? Switching to Consumer Price Index (CPI) data, the big increases were Heating & Cooling Appliances, Washing Machines, and Microwave Ovens.
Continuing with the CPI data, we can also get a glimpse of the wide divergence in price changes. Also, change from June 2016 shows that monster quarterly increases weren’t a trend.
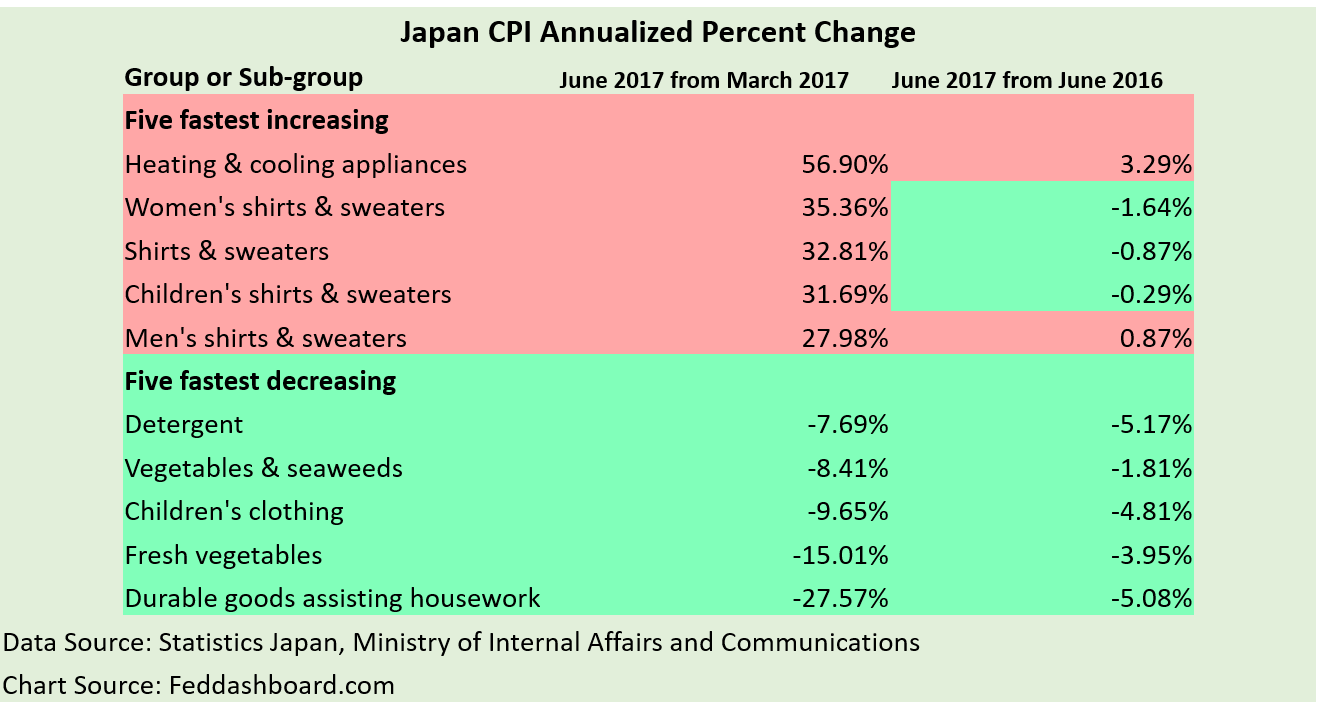 Reviewing the details of the 748 items and groups tracked by Statistics Japan also highlights:
- The assumption of “inflation” as primarily caused by monetary policy isn’t true. Mathematically, “inflation” is the weighted average change of all prices, with many causes beyond monetary.
- The wide variation in price changes means “average” “inflation” is an illusion and 2% “inflation” target is elusive.
Now that we’ve removed some noise, let’s turn to what most analysts have been missing…
Focusing on Signal – Shoppers buy more when prices fall
Today, we take a new step in analytical depth with more detailed data from the Cabinet Office, ESRI. For comparison to the U.S., see our previous analyses with data from the Bureau of Economic Analysis.
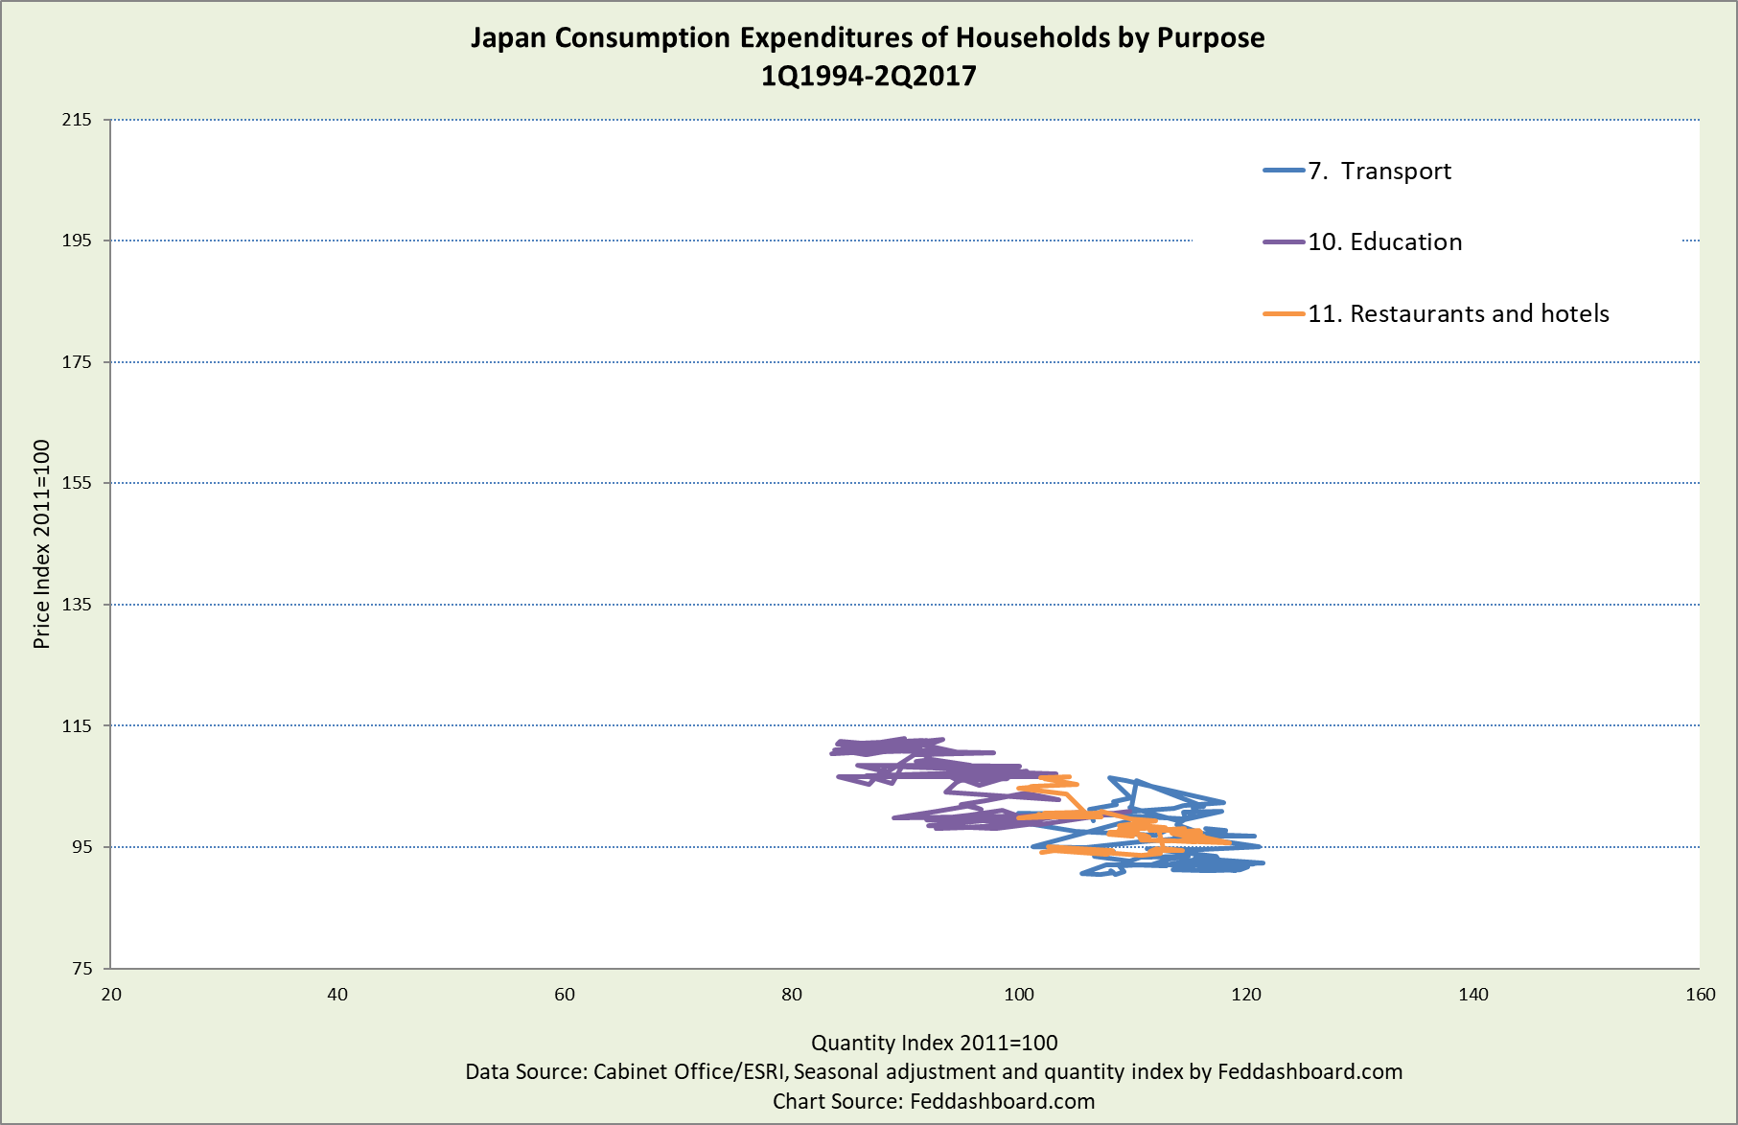
In the “Econ 101” price-quantity chart below, we see purchasing behavior over more than two decades. Each line joins the quarterly price-quantity data points for a purchase purpose.
- Downward-sloping lines mean that shoppers buy more when prices fall or cut purchases when prices rise. Thus, business and government actions that tend to lower price by lowering costs also tend to increase growth.
- Upward-sloping lines mean the reverse.
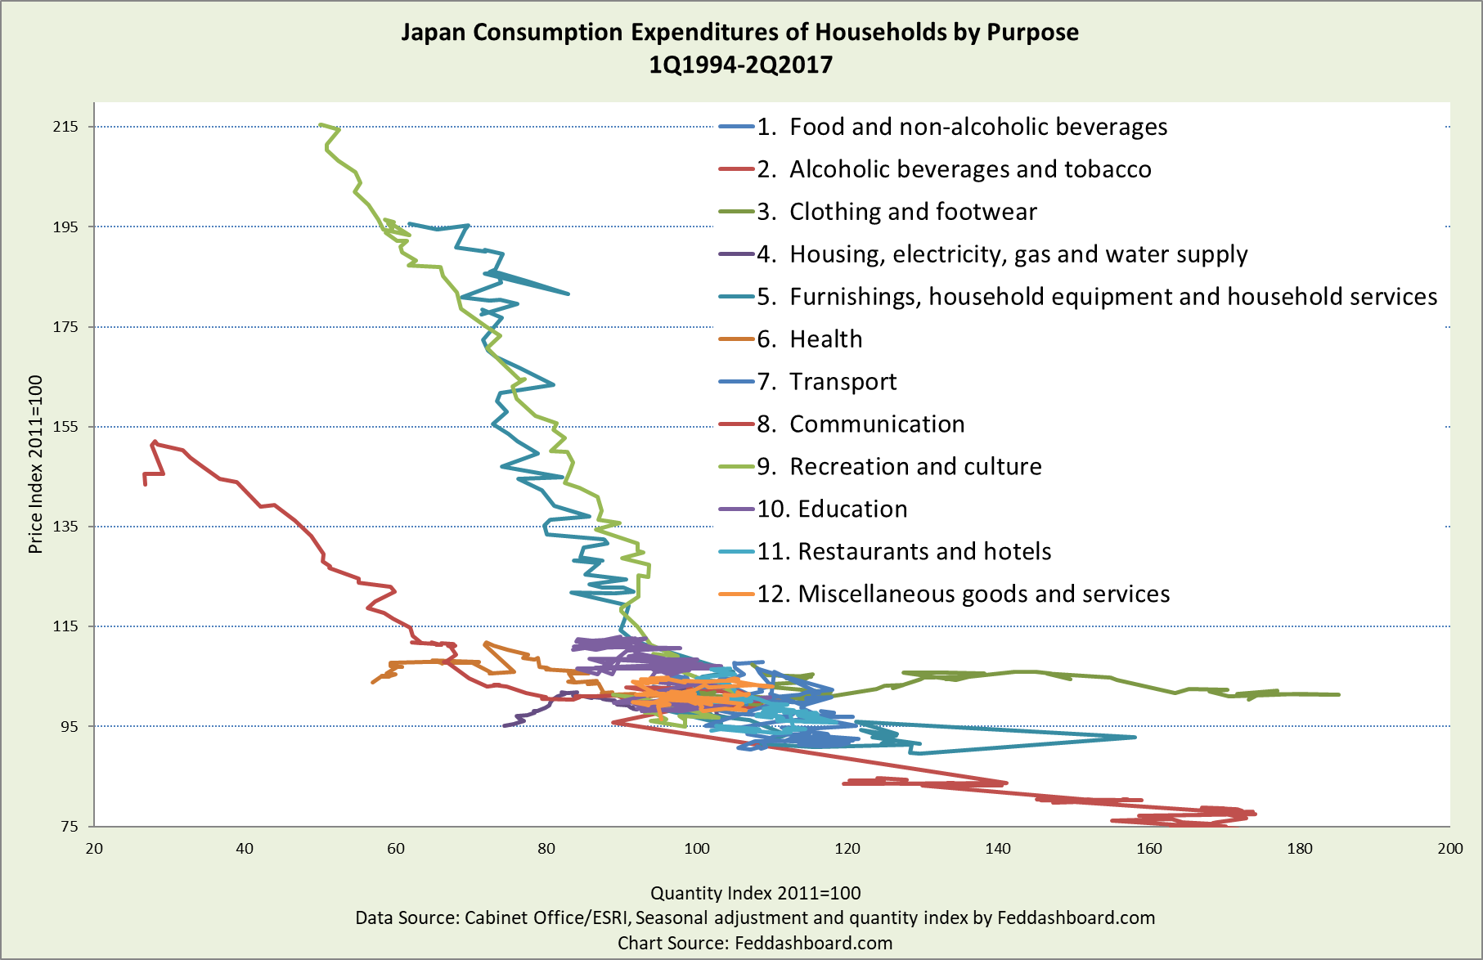 That shoppers buy more when prices fall makes perfect sense to shoppers. But it’s the opposite of economic theory that says shoppers must pay producers more to get more production. What’s wrong? Theory assumes scarcity. That scarcity would be reflected in upward-sloping lines on the chart.
Instead, data show downward-sloping patterns. Thus, the reality is that for goods on average (especially manufactured) industrial countries shifted into relative abundance over two decades ago, as we’ve previously illustrated with data from several countries. For Japan, we’ve illustrated the pattern for durables, semi-durables, nondurables, and services.
Understanding this shift is vital to inform investment and policy decisions. This reality flips our understanding of growth, inflation targeting, neutral interest rates, potential GDP, productivity and more. Instead of adjusting to these global trends, central bank efforts to raise prices have been stymied by both business reality and their governments’ structural reforms.
To clarify the chart above, the next three charts group by pattern.
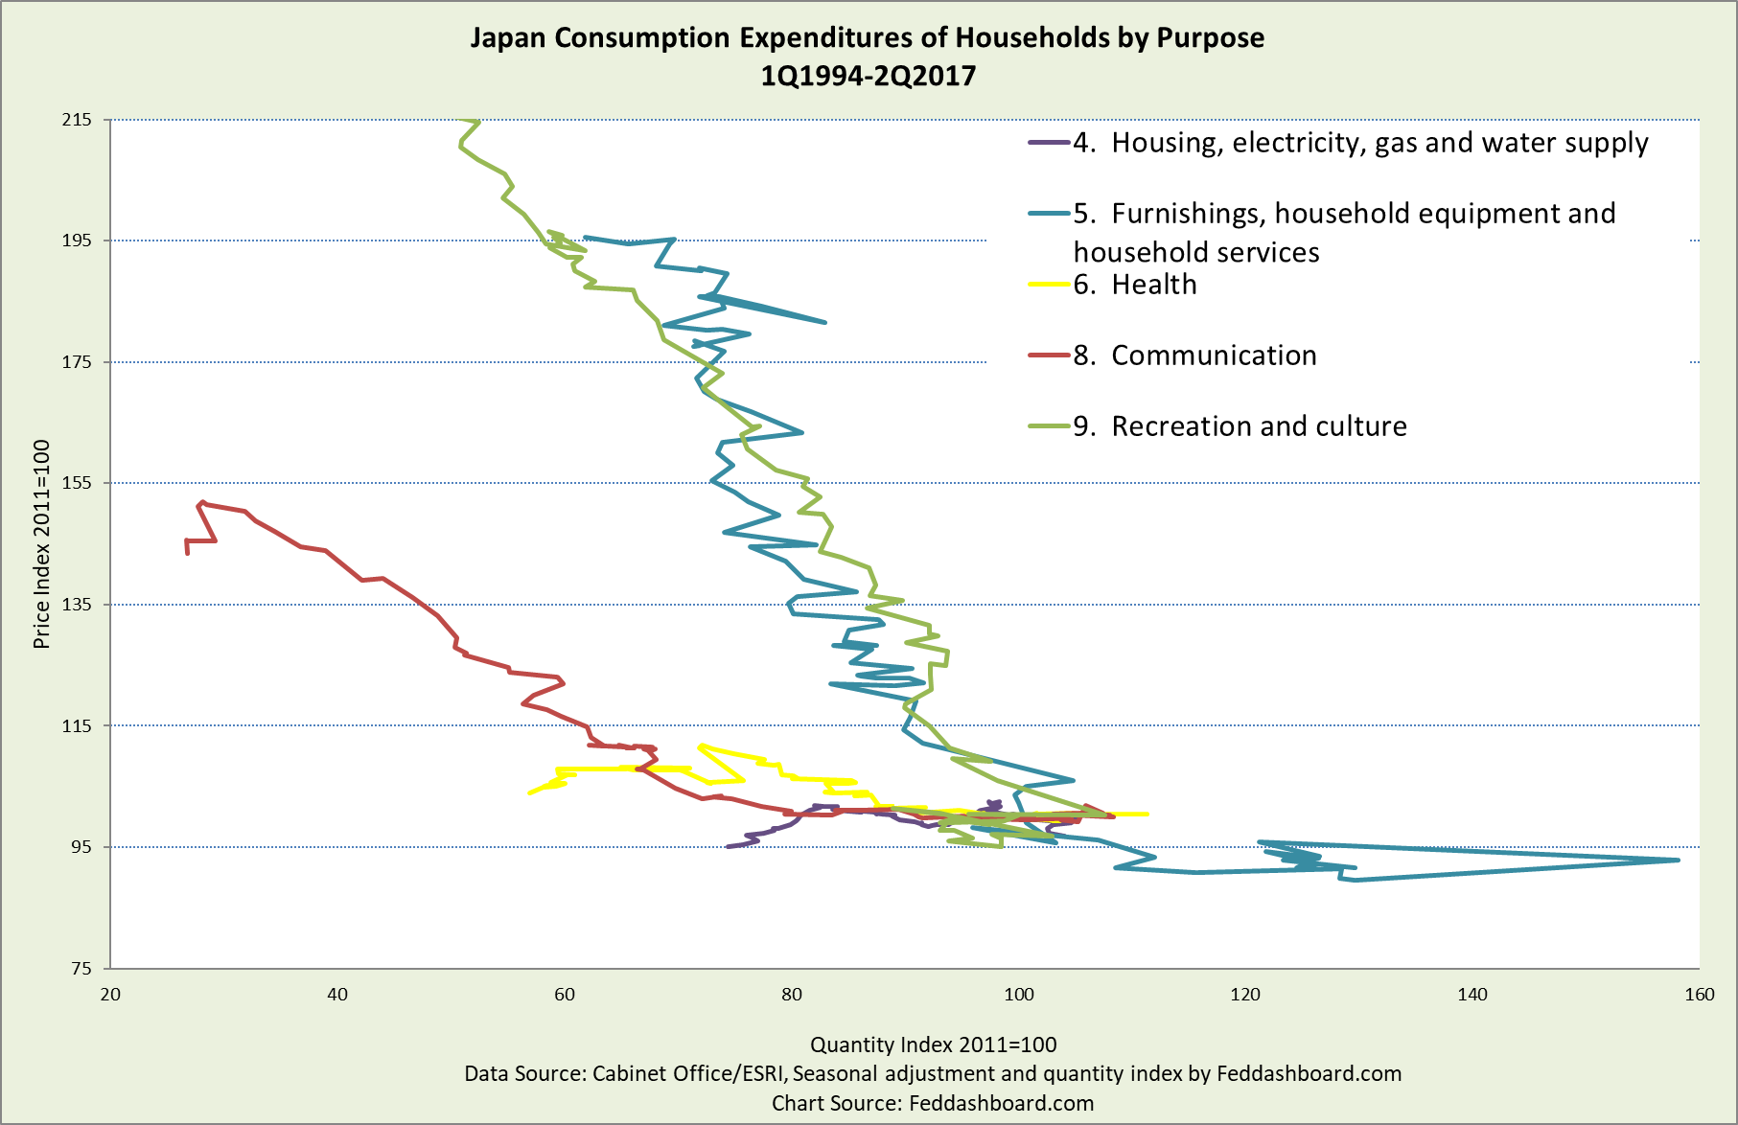
First, the categories with the strongest expansions.
- Mobile phones are included in “Communications” and most other consumer electronics are in “Recreation and culture”
- Consumer electronics sprung from “Japan Inc.’s” improvements in management technique (such as Deming methods) and technology – and were exported to the world so that Japan became the pioneer of the global tech and trade transformation
- The sharp purchases expansion through 1Q2014 and then contraction reflects the value added tax increase on April 1, 2014
- As we’ve noted previously, the average Japanese shopper grew purchases of durable goods faster than the average U.S. shopper over the past two decades until 2014. Japanese shoppers were also paying down debt while U.S. shoppers were mostly increasing debt.
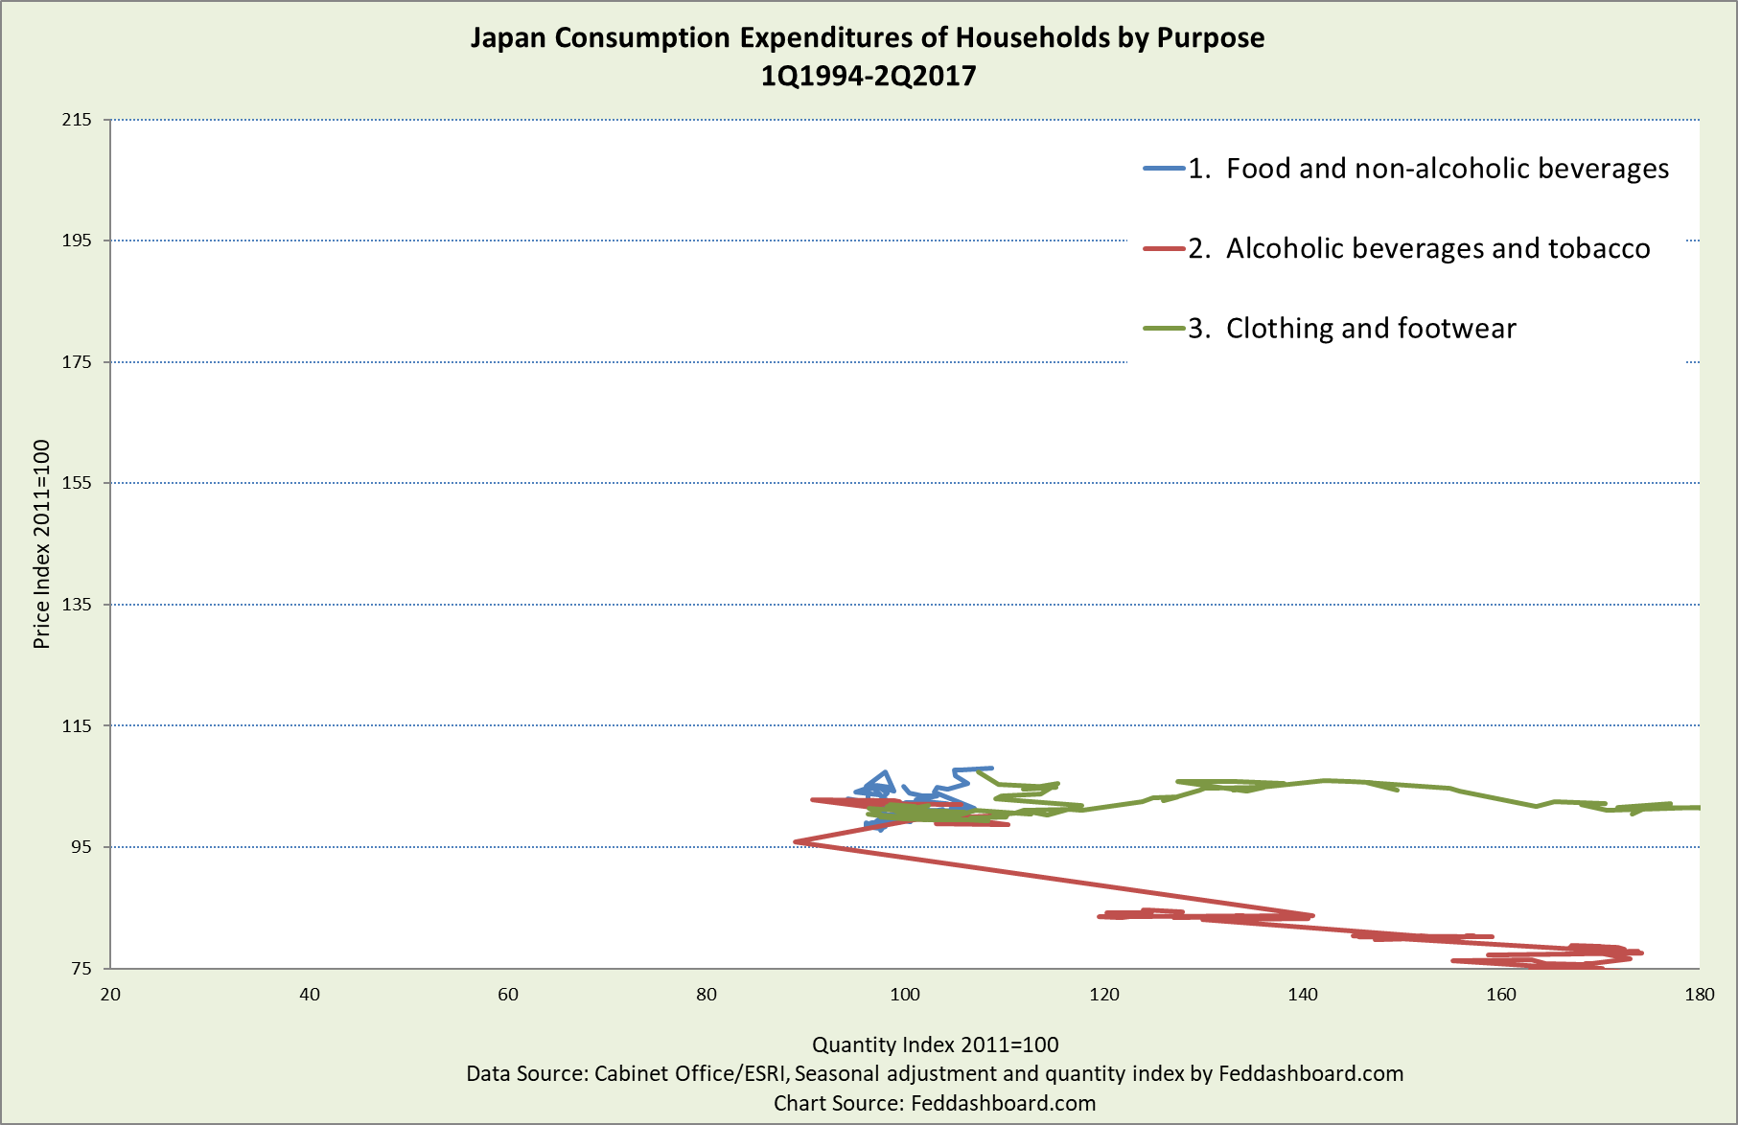
 Second, three categories that are demographic-driven as we’ve described previously.
- Alcoholic beverages and Clothing and footwear contracted significantly, especially in children’s and traditional Japanese clothing.
- Food expanded slightly
It’s difficult for one person to eat more bowls of rice or wear more pairs of socks.
Third, the “averages” categories are purposes with different stories within their categories that, when averaged, show little movement.
- Transport blends together everything from price of gas to vehicles to road tolls to public transportation
- Restaurants and hotels show interesting patterns reflecting preferences of both younger and older people
Education is tied to demographics with a decrease in price when the government introduced a high school subsidy in 2010. The subsidy is an example of a government policy action with more impact than QE.
Notice the downward-sloping tendency.
 The points above on demographic impact (especially the lack of a population pyramid) frame a key distinction – don’t confuse total country purchases with purchases per person where Japan is stronger.
Japan’s path to economic Olympic gold continues to rest on babies, structural reform, exports, and innovation. Reforms and innovation will naturally lower costs and prices to both help revive “Japan, Inc.” and make raising children more affordable.
For investors, this means:
- Updating macro model inputs to 1) remove noise and 2) expect real GDP growth with lower, not higher, prices.
- Seek companies improving efficiency, taking advantage of structural reforms and/or targeting exports or domestic purchase growth
To learn more about how to apply these insights to your professional portfolio, business or policy initiative, contact “editor” at this URL.
Data geek notes:
- Japanese CPI and household consumption deflators vary more from each other than do those measures in the U.S.
- “Purpose” categories used in Japan, Europe and elsewhere blend goods and services so the sharp behavioral distinction between goods as services isn’t clear as it is in product type data used in the U.S.
- For purchasing purpose categories, a rough multiplicative (proportional) seasonal adjustment was calculated after adjusting for linear trend

