As Japan’s expansion continues, compensation and especially savings are improving. The BOJ can now shift policy to avoid conflict with the structural reforms needed to grow exports.
True or false? “Japan’s Longest Stretch of Economic Growth in 28 Years Ends.” It depends.
- If measured as real (adjusted for price level change), seasonally adjusted, quarter-over-quarter and annualized Gross Domestic Product (GDP), then true.
- If measured as real, percent change from a year ago, then false. Viewed four-quarters, 1Q2018 was the thirteenth quarter of expansion, although fifth weakest. The year view better reflects decision cycles of businesses and investors and avoids seasonal complications.
When reading the most recent Cabinet Office national accounting data, realize that the data are 1) “headline” aggregate averages hide answers, and 2) country comparisons are often more appropriate per-person.
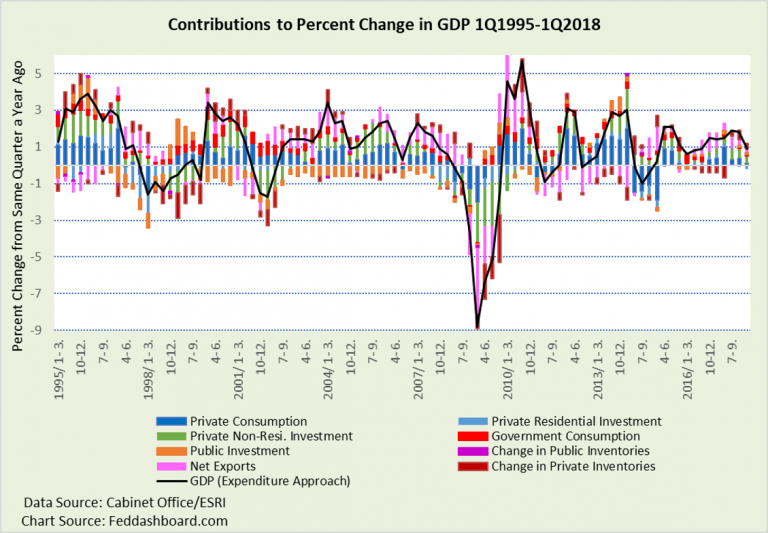
What contributed to first quarter weakness?
Compared to 1Q2017, the only negative was Private Residential Investment. Decelerating were: Household Consumption, Change in Private Inventories, and Net Exports.
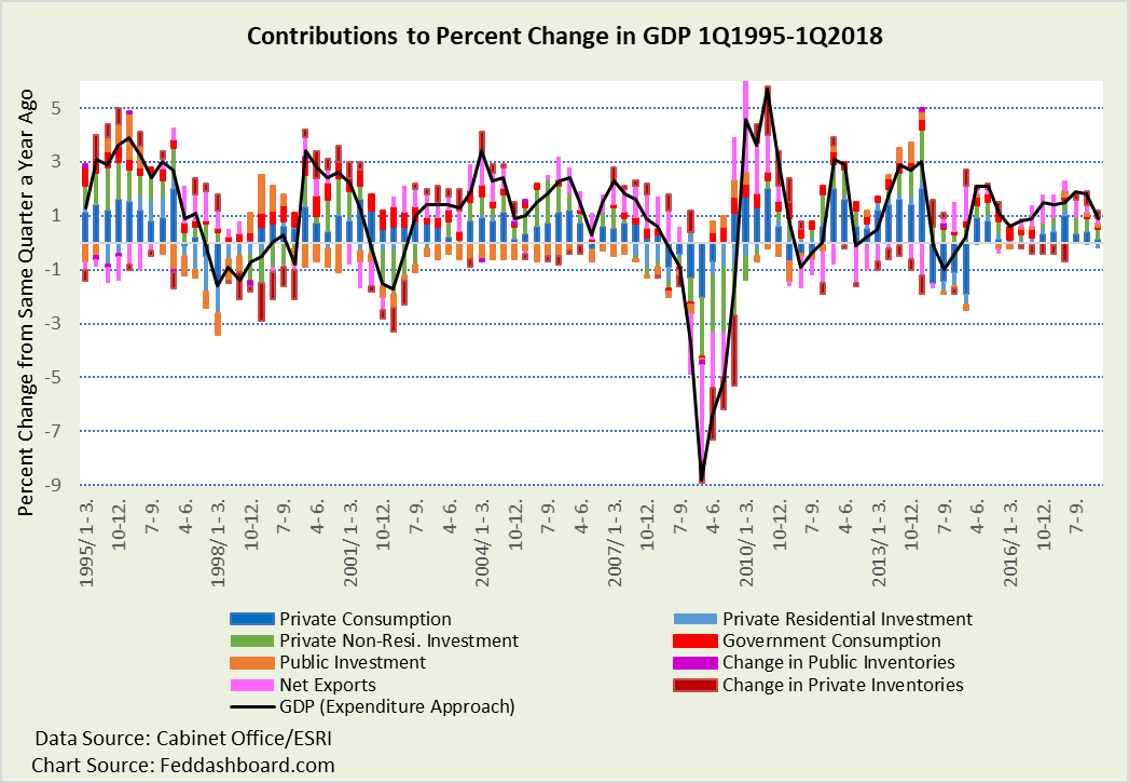 Net exports are notable because they are so variable. They are a concern because exports are dependent on global growth. Weak growth in Europe and trade issues with the U.S. matter.
Consumption of Households is 54% of GDP, the category with the most deceleration. Household consumption had 0.9% growth in 4Q2017, slowing to 0.26% in 1Q2018; again, compared to the same quarter in the prior year.
Japanese shoppers have not been in “decades of stagnation”
- Japanese consumers shopped well from 2001 to 1Q2014, stronger than U.S. shoppers in much-watched durable goods as we described in “Japan investors: discover this myth to seize opportunity more safely”
- Japanese shoppers accomplished this while paying down debt through 2012
- Shoppers splurged and then cut back April 1, 2014, when the Value-Added Tax (VAT) increased and the Bank of Japan (BOJ) was aggressively trying to increase prices with quantitative easing (QE).
The most remarkable growth has come in durables (blue line below) in the time track of price and quantity purchased. Shoppers buy more – not less – as prices fall. This data is the opposite of the theory that says prices must rise for purchases to grow over time.
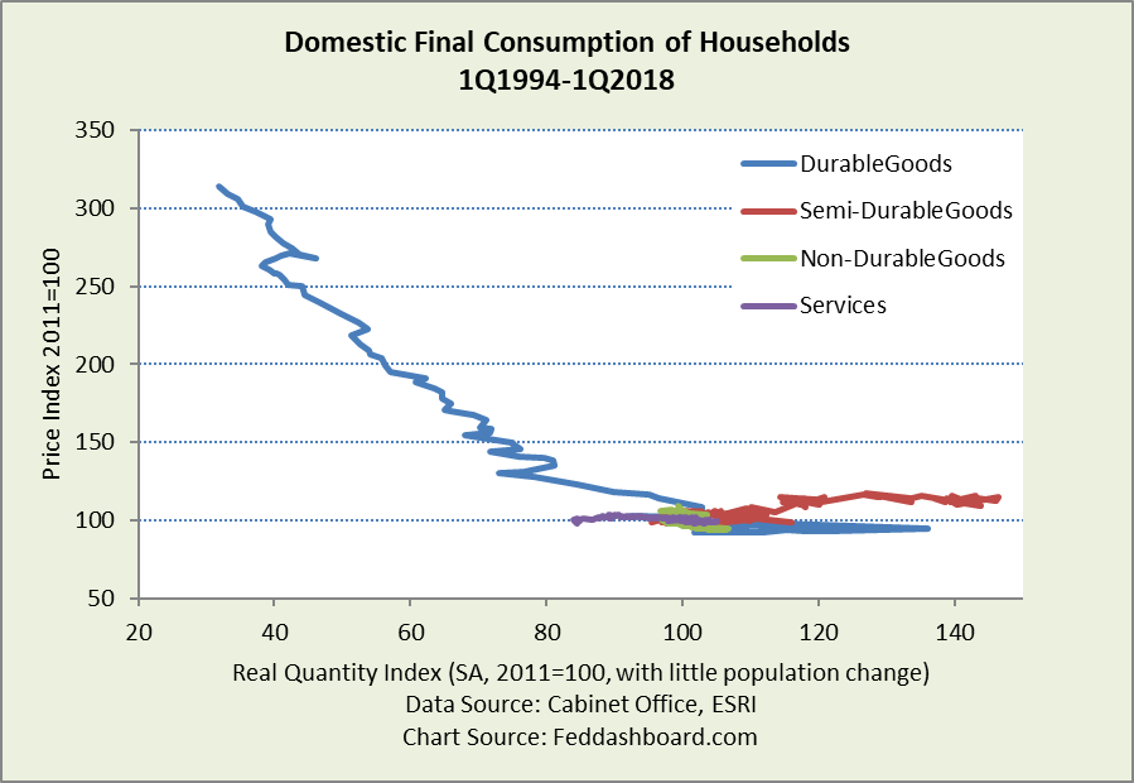 This index view zooms-in on the relative growth of each category, including dramatic expansion in durables. The quantity in real Yen view is at “Japan’s economy — ready for the next policy step.”
More detailed purchase categories are illustrated in “Japan – three changes most investors miss that matter more than QE.”
On the demand side, influences include energy conservation measures on non-durable purchases and demographics on a decrease in children’s clothing.
On the supply side, some ponder “The only mystery is the weak performance of prices.”
- Decades of Cabinet Office data and more detailed private data clearly show prices aren’t a mystery. Cost reductions flowed from improved management technique and technology of “Japan, Inc.”
- The Government’s structural reforms will further lower costs and prices. Due to Japanese innovations, capacity is widely available and Potential GDP is higher than assumed as shown in “Japan’s Potential GDP — greater than most people believe.”
- Labor has been falling as a production input. This reduces wage pressure on output prices.
- Where capacity is most constrained is in personally-delivered services, such as child care or package delivery. Yet, even in personal services, such as health care, Japan is aggressively pursuing robots.
People prefer to buy more for less money
In the mid-1990s across industrial countries, costs for durables fell enough that the average price began to fall as shown in “Central bankers: time to learn from political analysts.” This flattened the average price for goods as seen in the price-quantity chart above.
People feel price level changes differently by location and “shopping basket. A shopper who is less than about 35 years old has no memory of a time of rising goods prices (other than food and energy), especially shoppers living outside of urban areas. Japanese online shoppers know that lower prices are available in other countries. Lower prices flow from the global tech and trade transformation ignited in the 1970s by “Japan, Inc.”
Shoppers and elected officials across countries welcome the reality of lower prices from lower costs. By contrast, in Japan, this is negatively labeled “deflationary mindset.”
The Bank of Japan’s Opinion Survey on the General Public’s Views and Behavior reflects the clash between public perception and BOJ’s attempts to implement pre-1980s theory.
- Over the past three surveys, 6.2%-8.4% of respondents expect prices in the next year “will go up significantly” – far less than the BOJ policy aims. About two-thirds expect prices “will go up slightly.” Looking out five years, over 20% expect a significant increase and about 60% a slight increase.
- At the same time, about 80% view a price rise as “rather unfavorable” – not what the BOJ hopes. About 3.5% view a price increase as “rather favorable.”
- Yet, in a bit of cognitive dissonance (or deferral to authority) about 30% view a price decline as “rather unfavorable.”
- In both questions, about 15%-22% reply “difficult to say.”
Surveys from other sources reveal further conflicts.
Japanese employee compensation has not been stagnant
In addition to shopper strength, employee compensation has been growing for about the past four years, nearly at pre-Asian Flu highs.
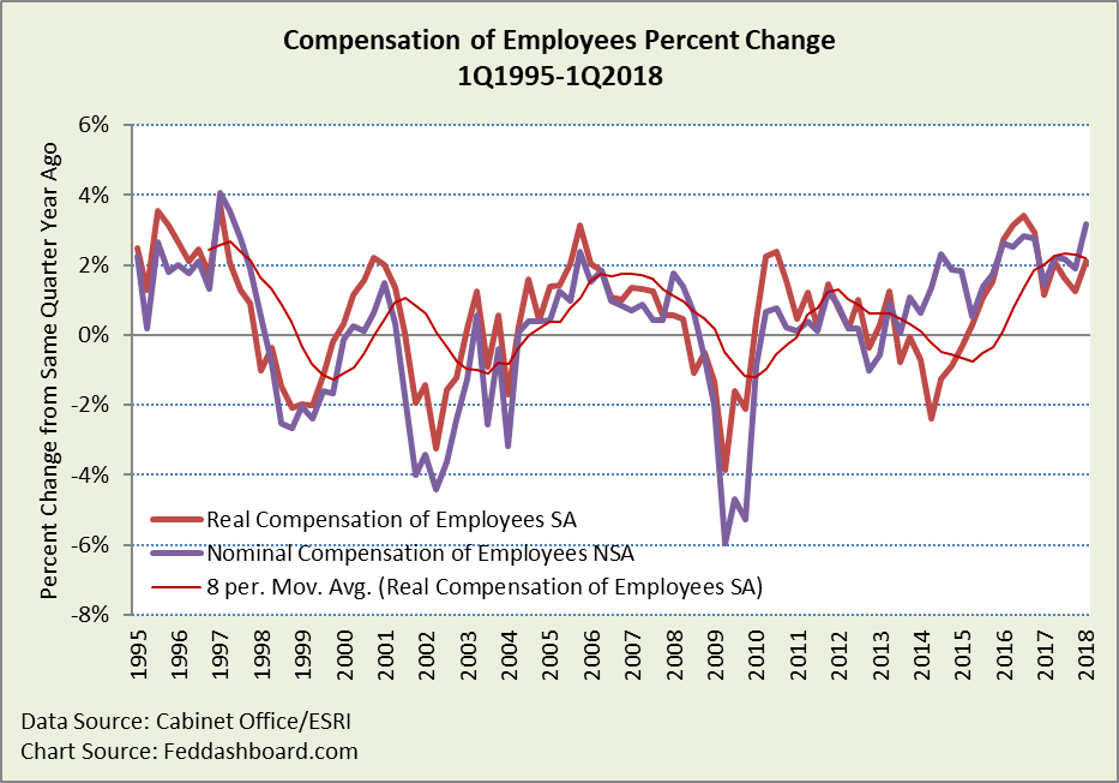 Nominal and real wages are shown because the difference is price level change. In 2Q2014, the VAT was a hit to real wages. Food and energy are often the cause of swings. Other income was explored in “Japan real income growth says it’s time to shift monetary policy.”
Savings are good
Japanese shoppers showed strength while paying down debt through 3Q2012. Recently, compensation has been rising faster than spending, contributing to savings, and historically rare.
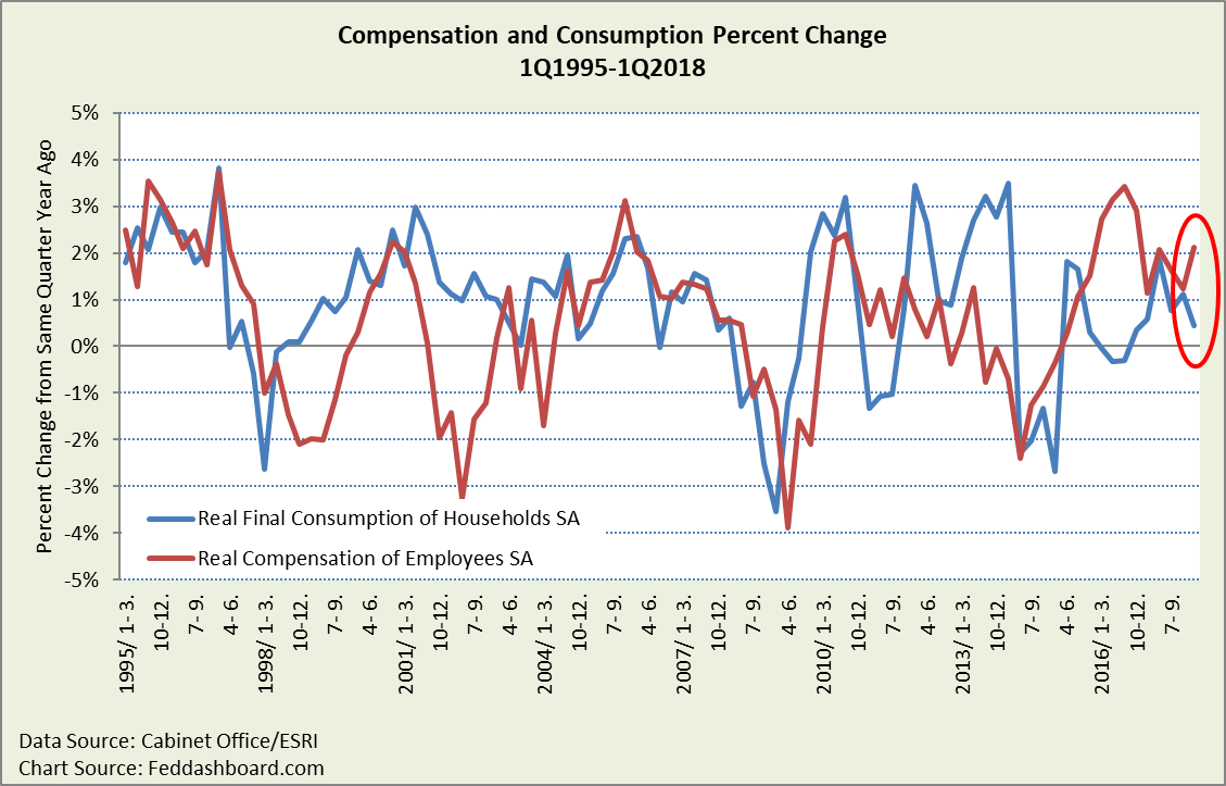 Pushing consumers to spend, rather than save, is possible. The question for policy-makers is how much savings is bad.
Causes of first quarter change matter most
Shoppers have been solid for years. Yet, the first quarter was different. Most interesting is how shoppers bought fewer durables and semi-durables, even as prices fell (“less for less,” rather than the typical “more for less”).
- Fewer semi-durables (much of which is clothing) has happened before with Japan’s demographic change and how elders buy less clothing than children
- For durables, some suggest that weak smartphone sales hurt most
A question is whether the lower spending is due to short-term reasons such as the shock of the 5.56% increase in non-durables prices (annualized from prior quarter), savings preferences, satiation with consumption, demographics, or other. Different causes require different actions.
Babies, not BOJ
Japan’s weak aggregate consumption isn’t about purchases per person, it’s about people – in number and demographics as seen in its population pyramid. Japan needs babies.
Until babies come first, economic policy-makers will be frustrated to the extent that:
- Consumption increases relative to income, it tends to slow debt repayment
- QE raises prices, higher prices are likely to hurt consumption – a direct hit to GDP
- QE conflicts with structural reforms to lower costs
- Excessively negative messages about economic health probably hurt personal sense of financial security and likely discourage babies
Exports, innovation, and lower prices
The scale of needed export growth is more than major industrial countries are capable of generating in additional demand, unless Japan significantly grows market share. Large countries like Japan need emerging market growth with hundreds of millions of consumers seeking a boost in living standards. For countries to develop they need political stability, security stability, and rule of law. China, with its “long game” view, is making investments across the global south. Japan has recognized this and increasingly acting.
Japan’s opportunity is to leverage its heritage of managerial and technological innovation to continue to lower costs and prices, improve product management, and more safely seize opportunity in emerging markets.
To learn more about how to apply these insights to your professional portfolio, business or policy initiative, contact “editor” at this URL.
Editor’s note: This post was updated June 8, 2018 after the secondary preliminary data release. Primary change was an improvement in Private nonresidential investment, now with the same contribution to GDP as in the prior quarter.

