
People holding dividend-rich portfolios got a nasty shock when prices turned town. With prices back up, the question is whether there is a better way to pick higher-dividend stocks. Yes, three measures help filter for stability.
In the hunt for yield, many savers switched from bonds to higher-dividend stocks. In a Fed-fueled equity market, there was little downside fear, and the usual trade-off between growth and stability was often forgotten. Now in monetary policy transition, more people are seeking dividends with price stability.
Is there a better way to pick than screen by dividend yield?
Yes, with the usual caveat that “better” is a balance in the eye of the beholder. In particular, when evaluating “risk,” a question is whether that “risk” is measured in volatility (standard deviation of returns) or liquidity in the sense that funds are available when needed with low downside price risk.
Depending on how you evaluate risk, you can trade-off three measures.
The first two are 5 year historical dividend growth and 52 week percentage price change relative to the S&P 500. These are easily viewed in the Screener of Zacks Research System (ZRS). The blue dots are S&P 500 member companies.
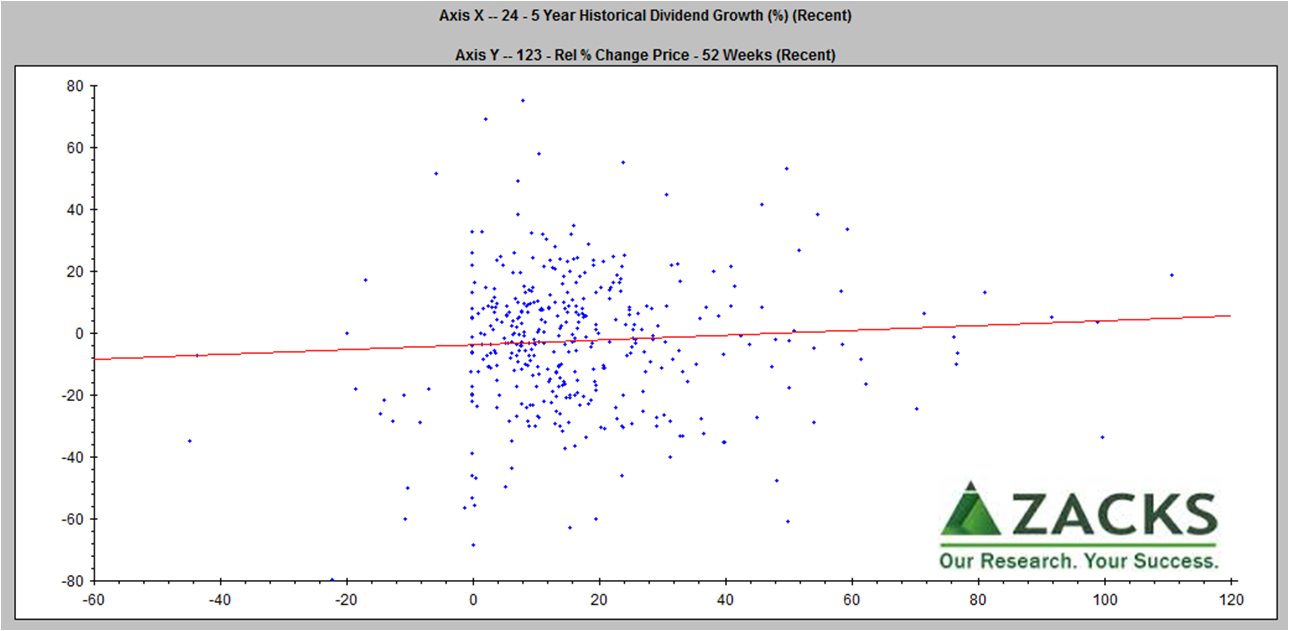 In this view, “goodness” is to the upper right — both stronger five year track record of dividend growth and outperforming S&P 500. Five years helps provide a view of consistency. Of course:
- This is dividend growth, so compare to original screen on dividend yield.
- Both growth numbers are averages over time, so check the actual patterns.
To check dividend stability, ZRS provides our third measure — the R-Squared of the five year historical dividend growth. A higher R-Squared means tighter the fit to trend line growth. This indicates a more stable growth rate (not that the dividend itself is unchanged).
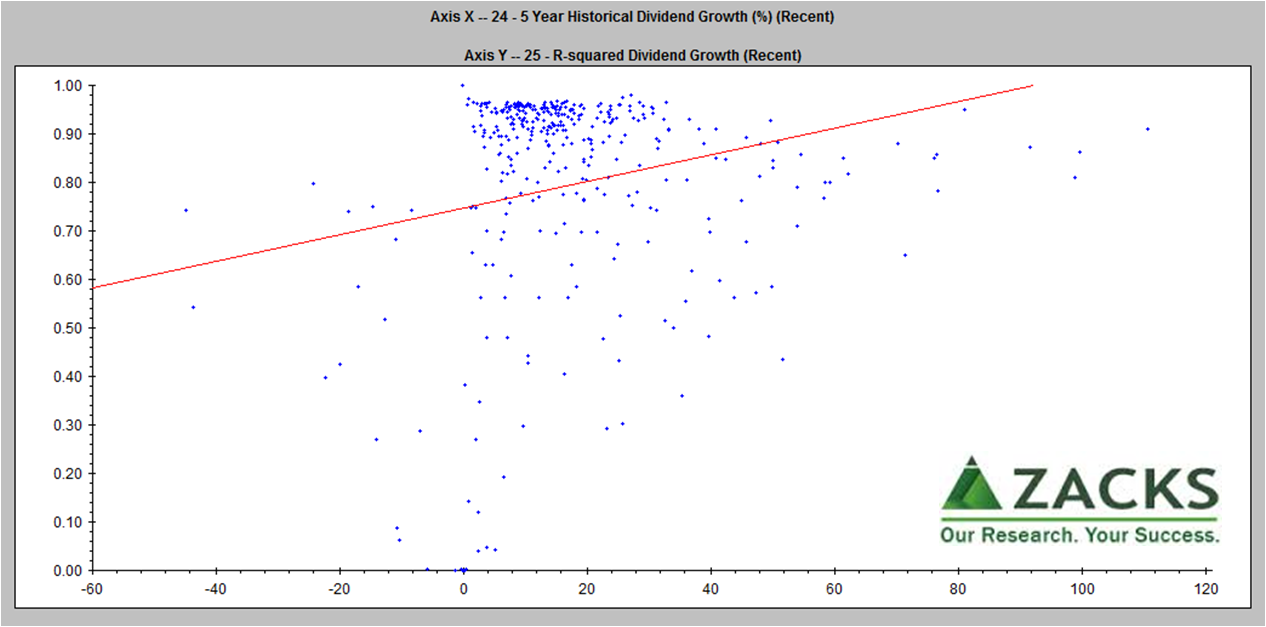 The blue dot concentration shows most companies are signaling consistent growth rate (over .9 R-Squared). “Goodness” is again to the upper right with consistently higher growth dividends.
Your yield
Investors using these measures are taking the next step after screening by yield. When rebalancing your portfolio, track your yield. Any software tool that doesn’t know your current holdings will calculate dividend yield based on current, not original purchase price. In a rising market, a screener list of yields based on current price basis will understate yield on what you purchased at a lower price – your yield matters.
How much price exposure must be suffered in pursuit of dividends?
Zacks Earnings Certain Proxy (ECP) illuminates an answer. Zacks ECP focuses on highly stable companies that produce consistent earnings; it excludes interest-rate sensitive and hyper-growth companies. Compared to Zacks S&P 500 equal weighted composite proxy, Zacks ECP companies gained more lift from the Federal Reserve (red Adjusted Monetary Base line) nearly doubling price returns and more than doubling dividend per share growth.
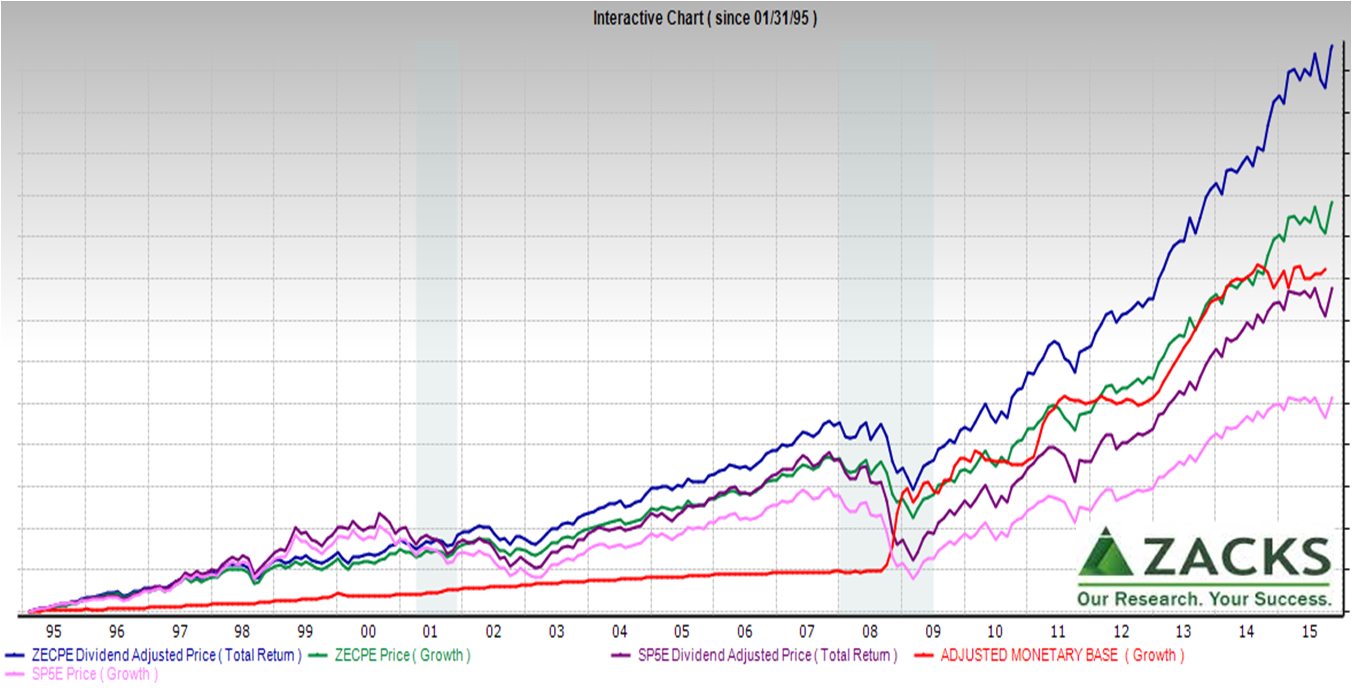 Note: All lines are percentage growth for comparability.
Quarter to quarter, one proxy may outperform the other. Zacks ECP companies were cumulatively behind during the dot com bubble. Today in the lead, Zacks ECP cumulative performance seems to have come more from avoiding dips. The point is that a dividend emphasis doesn’t have to sacrifice price.
More, as is our frequent refrain – averages hide answers. So take the extra steps to determine what’s right for you.
Data Geek Note: For more on the St. Louis Federal Reserve Bank Adjusted Monetary Base, see https://research.stlouisfed.org/publications/review/03/09/Anderson.pdf