
Despite the world awash in cash seeking return, just five companies hold 25% of the total cash of S&P 500 members. Thirty-three percent of the cash is concentrated in eight companies. This picture highlights dramatic differences.
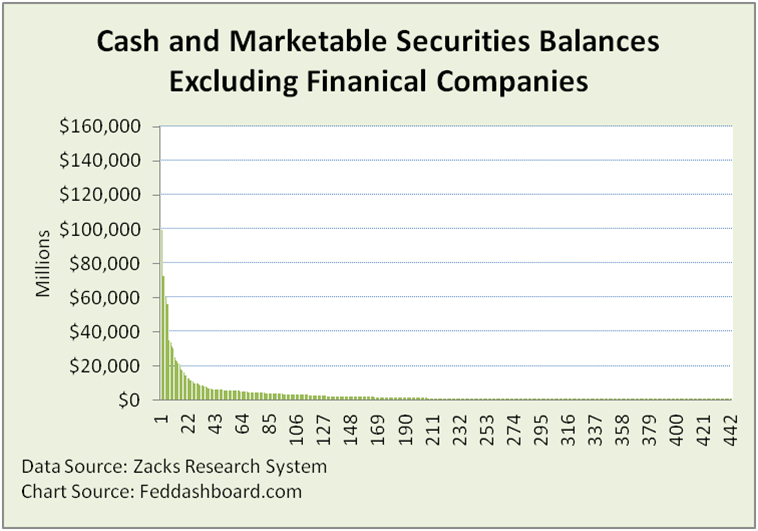 Cash can be counted different ways. This version shows the amounts reported as Cash & Marketable Securities to the U.S. Securities and Exchange Commission, quickly extracted through Zacks Research System. Financial companies are excluded. Included are financial arms of companies such as General Electric and Ford.
By this count, the top five are General Electric, Microsoft, Alphabet, Cisco and Amgen. As General Electric has a financial arm, Oracle is next. Adding Apple and Johnson & Johnson takes the tally to 33%. Half of cash and marketable securities are held by 23 companies – less than 5% of the S&P 500.
Why isn’t Apple #1?
Apple and other companies hold bounty also as debt and equity investments with maturities over one year. Adding these to cash and marketable securities paints an even more striking picture.
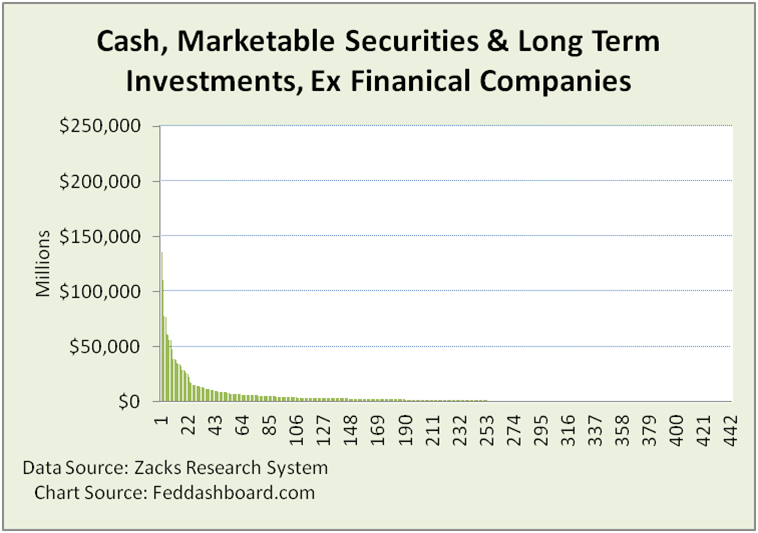 Here, the “five with twenty-five” (percent, that is) are: Apple, General Electric, Microsoft, Alphabet and Ford. As GE and Ford have financial arms, the next two are Cisco and Amgen. Adding Oracle makes it 33%. Twenty-one companies total to 50%.
The caution with this method is that some investments are less liquid than others.
In either view, the point is stark contrast.
How much is due to company size?
 Standardizing for sales, we see Yahoo! has over 6x and Altera has over 2x more than annual sales. Then, 22 companies have 1x-2x more than annual sales starting with Verisign, Vertex, Amgen, Xilinx, Intuitive Surgical, Oracle, Qualcomm, Gilead, Cisco and Monster Beverage.
Companies hold cash today for more than transactional reasons, including tax and liquidity risks related to financial system and government action.
Is cash the crown of success?
It depends.
- Is it the result of a powerful business model or a stagnant stash?
- Is the company actively making bold new investments? Or, is it stalled in short-termism hesitant to fund all investments with positive net present value?
Answering these questions is how business model-based investors discover opportunity.