
Vanishing equity risk premiums are frequently debated. But why are they shrinking? Have investors stopped caring about risk? Data illustrate the vanishing act isn’t magic; it is monetary policy and measurement. The model matters.
The equity risk premium (ERP) is the amount (premium) investors earn for taking the risk of buying equities instead of a “risk-free” asset, often defined as a U.S. Treasury bond.
ERPs dropped in 2012 leaving analysts speculating, “Why?” Commentators often opine the market simply “absorbed” this loss and investors are willing to accept less return (premium) for the risk taken.
Is there more to the story? Yes, much more.
Once Upon A Time…
When cash was scarcer and capital asset pricing model young, investors could mark-up bond returns with an ERP. But, as global cash – from households, endowments and companies — became more abundant, the mark-up concept was challenged.
As this happened, it became clearer the ERP is really just a residual, like velocity of money. ERP isn’t actually measured. It is the residual left over by subtracting a “risk free” rate from average market return.
Will the real ERP please stand up?
The next reveal is that the EPR is rather murky with multiple definitions. A staff research paper at the New York Federal Reserve cataloged 22 methods in 5 categories common in academic research. Beyond these are those used by investors. The authors noted the wide range of estimates produced by different methods.
Zacks Research System (ZRS) includes a helpful method for fundamental analysts. The Zacks Valuation Model is in the discount model category, with three useful distinctions:
- Discounted are earnings per share, rather than dividends, to be dividend policy agnostic
- Uses the Zacks Earnings Certain Proxy (ECP) rather than the S&P500 or other broad measure of market returns. Zacks ECP focuses on highly stable companies that produce consistent earnings; it excludes interest-rate sensitive and hyper-growth companies. This makes it easier to differentiate market from industry or company-specific risk.
- Uses Moody’s constant maturity seasoned Aaa bonds as the “risk free” rate, rather than U.S. Treasuries, to make it easier to differentiate an equity risk premium from a bond risk premium (corporate bond minus U.S. Treasury of similar maturity). Today this is especially helpful in our world of extraordinary monetary policy.
The big picture
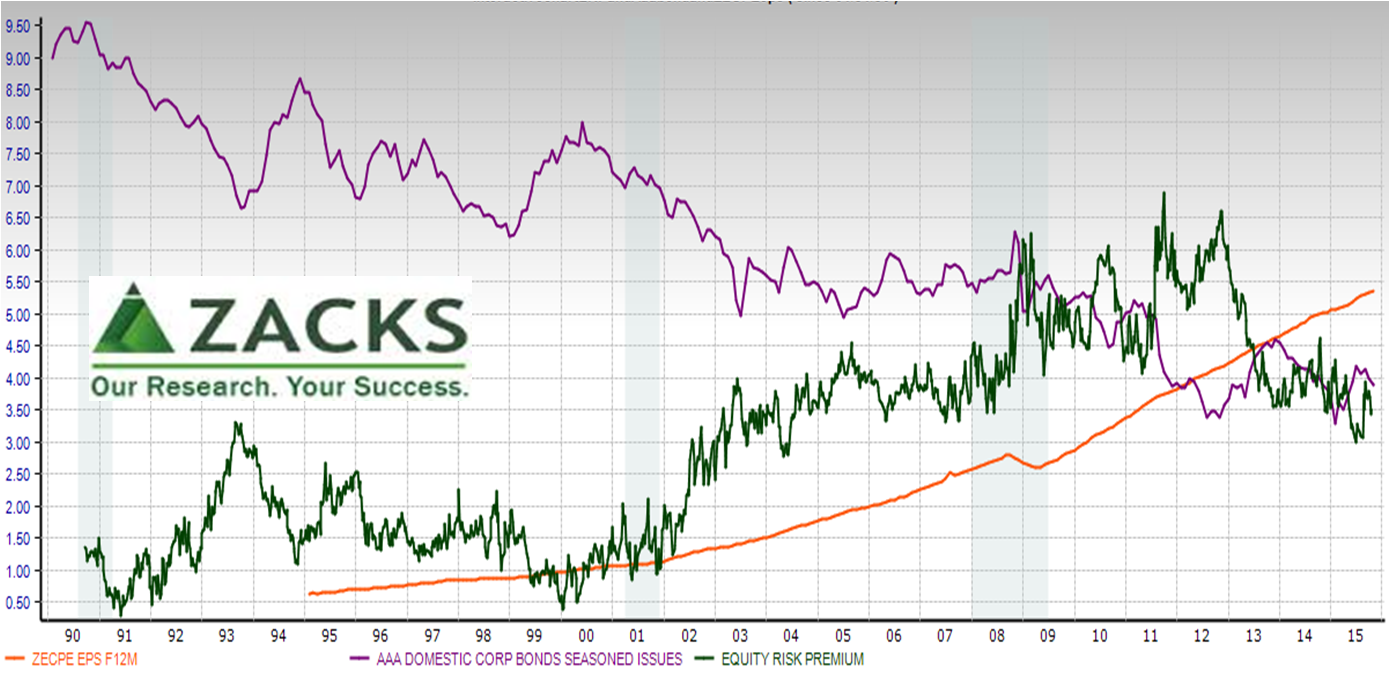 As you might expect from the math, ERP (green line) generally moves inversely with the bond rates (purple line) given forecast earnings per share (EPS) are more consistent than bond rates. Of course, with ZRS we also know forecast EPS are more bullish than actual. When the ERP and bond rates both fall, it means the equity benchmark fell more than the bond rate.
So if bond rates are important, what’s the monetary “mother load?” It is large scale asset purchases (blue line below), especially quantitative easing (QE) round three. As with other relationships, the power of the Federal Reserve is clear.
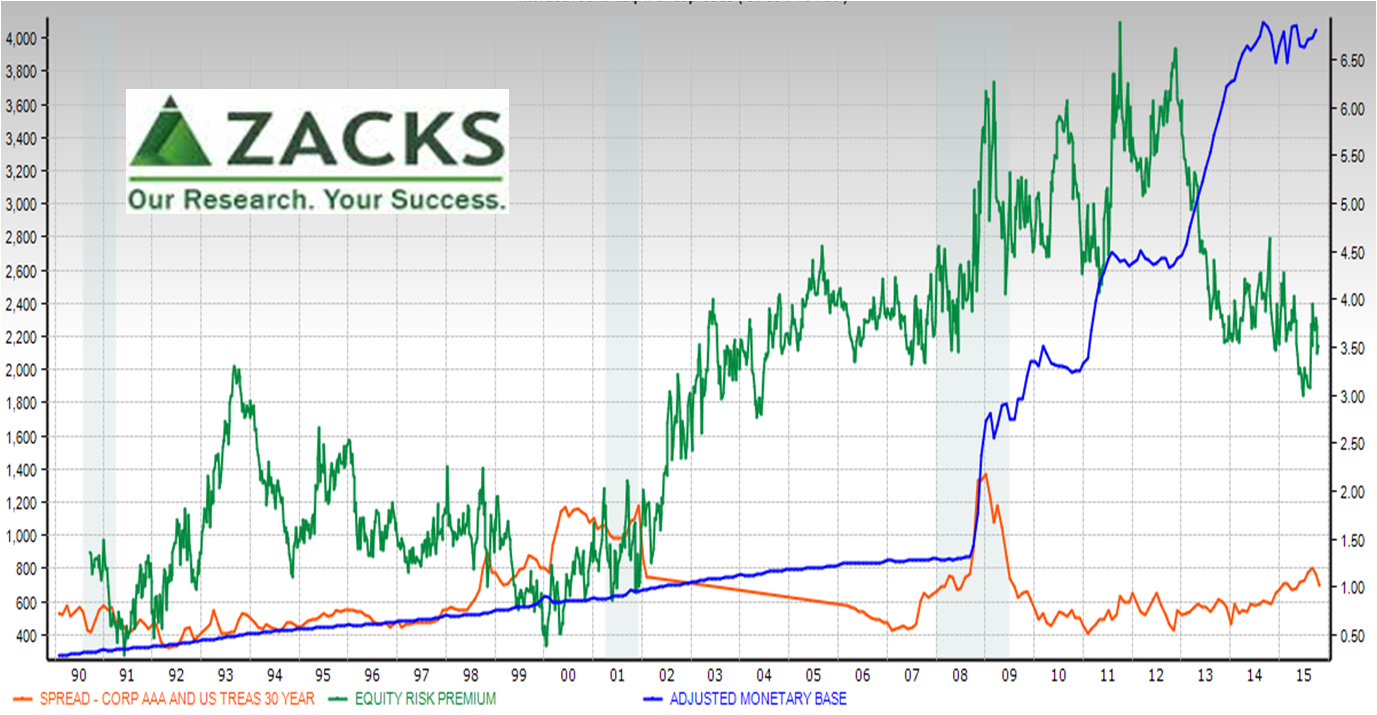 Note: Adjusted Monetary Base (blue line) is on left axis
The Fed did more than lower rates, it boosted equity prices.
- Most ERP methods are based on discounting earnings or dividends, rather than price or total (price + dividend) returns. Price or total returns methods show higher ERPs when price is growing. For discount-based ERPs, QE gave shareholders a bonus premium beyond calculated ERP.
- In lowering rates and shifting yield curve slopes, the Fed complicated the clarity of the risk free rate in terms of both level and duration differences.
For the past year, ERP, through Aaa bond rates, seems more related to “liftoff lightheadedness” and news from other central banks.
In short, caution is needed in generalizing. Most sound bite commentators entirely miss this. Don’t be misled.
Focus on Forecasting
So, do these details add value?
Yes, when determining price targets. In this tough job, a thoughtful ERP method in a more fine-grained valuation tool makes a difference.
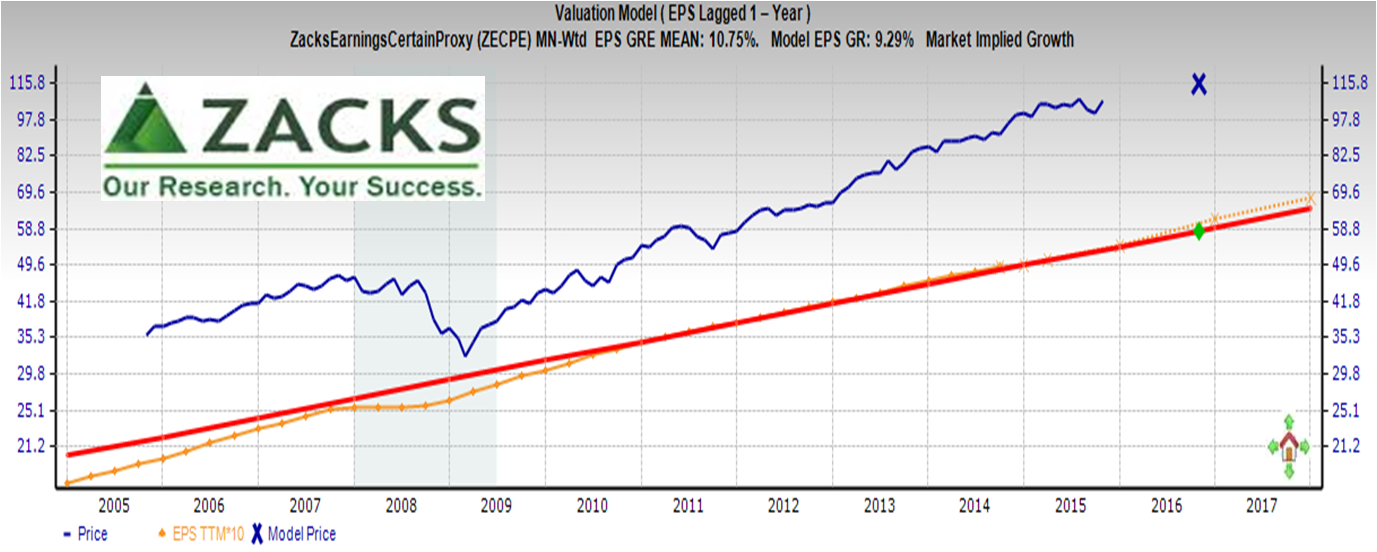 Here, the orange line is EPS (actual trailing twelve months switching to forecast). Red line is normalized earnings — future earnings discounted back in time utilizing the sustainable growth rate. Blue line is actual price with “x” marking the spot for the model generated price.
Putting fingers to the keyboard is where it matters to understand ERP nuances and have model ability to adjust granular settings. For example, here is where it matters to have clarity on equity-to-bond spread to better filter noise.
Bottom line:
- At broad market levels, ERP moves in recent years are not “absorption” magic, they are about monetary policy and measurement. Monetary policy is the primary driver of post-crash equity prices, and a performance touchstone for any equity.
- In individual equities, ERP falls out of a valuation analysis – a residual. The point of a valuation analysis to determine whether the market is right or wrong on future growth, price and warranted P/E. To determine this more easily, model matters.
Data Geek Notes:
- For more on the St. Louis Federal Reserve Bank Adjusted Monetary Base, see https://research.stlouisfed.org/publications/review/03/09/Anderson.pdf
- For a survey of analyst and textbook uses of ERP, see Fernandez, Pable, Otiz Pizarro, Alberto and Acin, Isabel F., “Huge dispersion of the Risk-Free Rate and Market Risk Premium in USA and Europe in 2015,” University of Navarra – IESB Business School, 2015. SSRN. PDF File.