The Fed is in a bad spot. Conventional wisdom says rates are low. But it’s only some rates. Yield spreads for medium-quality, investment grade corporate bonds are at historical highs. Raising the Federal Funds rate might add strain. Yet, to the extent the recent spikes reflect “liftoff lightheadedness” and mix of Fed’s Treasury holdings; the Fed might have a safety valve – “cap and lift.”
Federal Reserve Chair Janet Yellen offered a “cautionary note” when she remarked, “…significant uncertainty attaches to Phillips curve predictions, and the validity of forecasts from this model must be continuously evaluated in response to incoming data.” We agree.
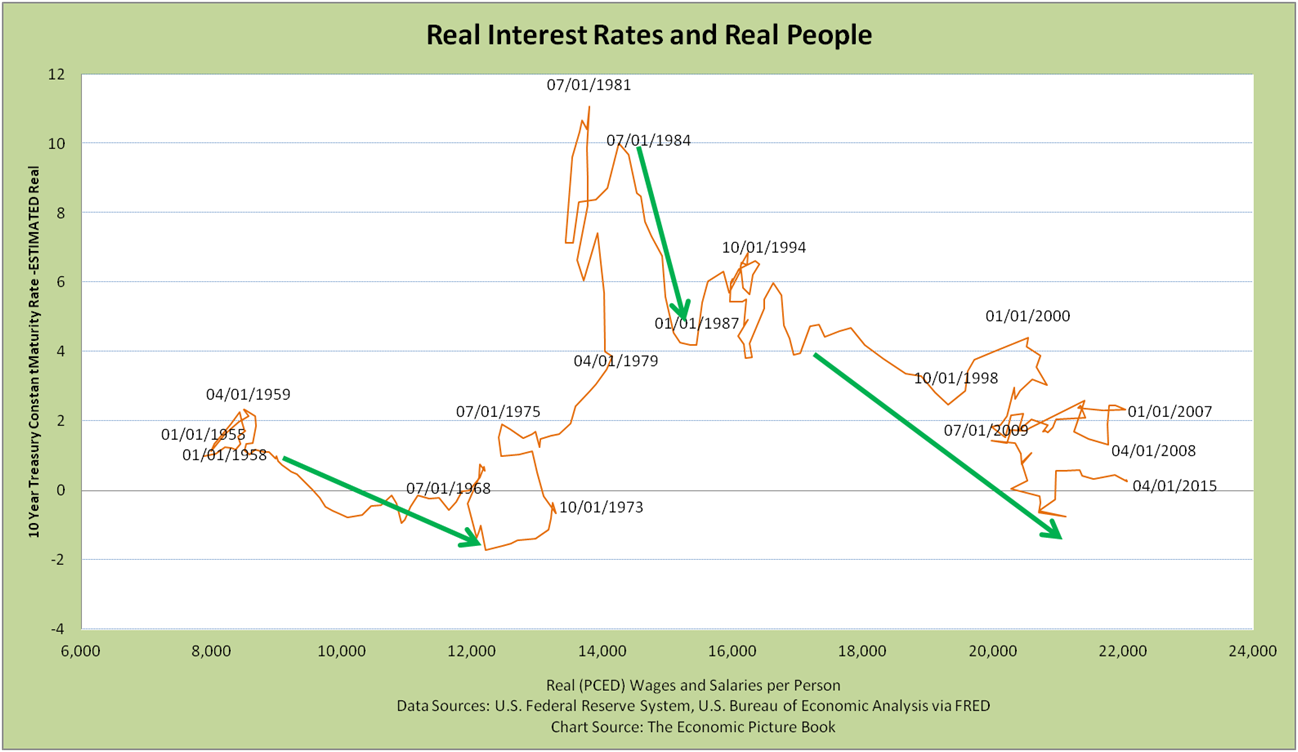
The Phillips Curve traditional measures are not the best measure for today’s questions:
- Job counts on the horizontal axis hide insight on income quality of jobs.
- Interest rate on the vertical axis misses changes in spreads between rates targeted by the Fed and rates felt more widely.
Today, “pocketbook measure” matters more than job counts
In “3 insights from the Real Rates – Real People Curve,” we suggested a better measure of employment health is the “pocketbook measure,” real wages and salaries per person.
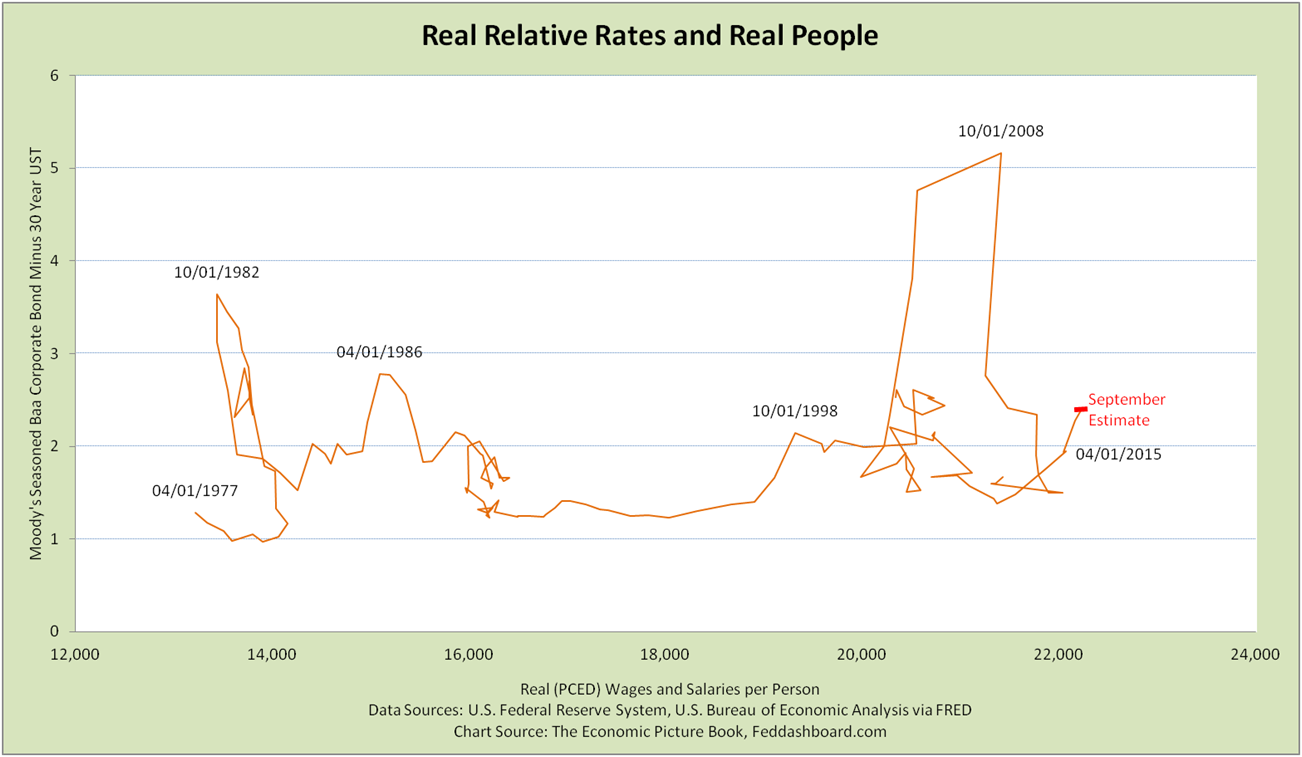
The pocketbook view reveals shifts in real wages per person that can’t be seen in job counts. The pocketbook measure makes it easy to see 3 spurts of real wages per person growth since 4Q1998.
The first 2 spurts reflect the dot com and credit bubbles — that collapsed.
For the third spurt, a question is whether it will: 1) stagnate until Fed’s shrinking balance sheet is offset by tangible growth or 2) continue to grow reflecting the PIPE Factors or other tangible cause.
In the Real Rates – Real People versions of the Phillips curve, each bump jolts us to see how job quality is affected by more than interest rates.
 The pocketbook measures for the first two quarters of 2015 were both above the previous high in 2007; although Q2 was lower than Q1. Monthly data for July and August both show growth.
Today, relative rates matter more than Federal Funds Rate
Relative rates to wider borrowers are helpful measures of economic pulse. This is done by starting with Moody’s Baa Constant Maturity Seasoned Corporate Bond and then using the 30 year U.S. Treasury to normalize for inflation, risk-free rate and duration.
Conventional wisdom says we’re living in low rate land.
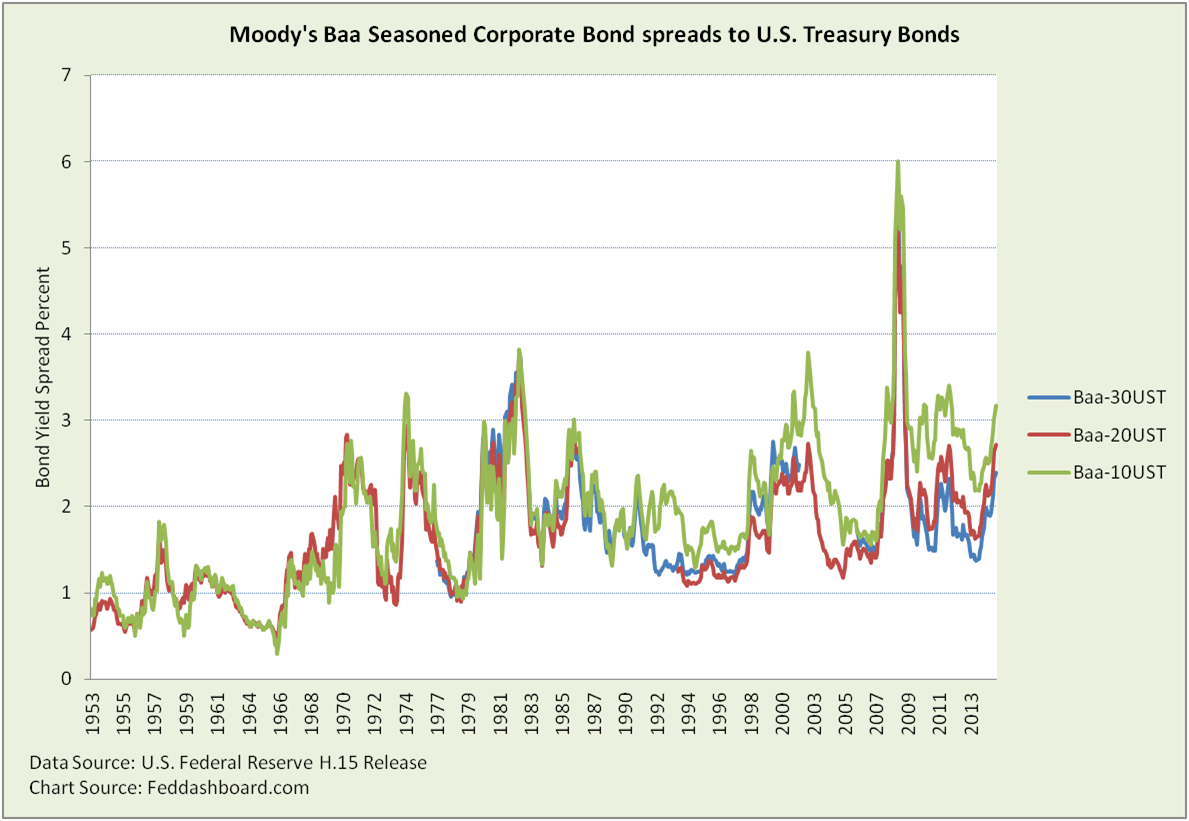
Not entirely true. It turns out the Baa-30UST spread is historically high other than 3 spikes.
Today’s spread is 2.6 times that of the mid-1990s.
 Spread has been increasing since August 2014 across maturities. Spreads are at historical highs since 1953 other than 3-5 spikes.
Why high spreads? Markets might be ignoring the Fed, over-anticipating it, responding to tighter bank regulation or coping with the Fed’s mix of Treasury holdings.
It’s bad for borrowers whether spreads continue growing or the Fed Funds increase is merely passed on.
Fed’s launch sequence fears
The Fed’s bad spot is how to BOTH raise rates AND overcome the spike in spreads. The spread spikes seem related to broader “liftoff lightheadedness,” including foreign exchange rates.
The Fed’s failsafe might lie in clearly communicating the natural interest rate has decreased – providing fresh air for lightheadedness and capping expectations of eventual rates.
Such a “Cap and lift” approach might strike the balance.
Until then, investors benefit by clearly separating tangible causes from market uncertainty – uncertainty swings on nervous news, tangibles endure.
Data Geek Notes:
- For the seasoned Baa corporate bond measure, the St. Louis Federal Reserve Bank notes, “Moody’s tries to include bonds with remaining maturities as close as possible to 30 years. Moody’s drops bonds if the remaining life falls below 20 years, if the bond is susceptible to redemption, or if the rating changes.”
- September estimate of real wages and salaries per person was created from related monthly data through August.
- The 30 year U.S. Treasury bond time series has a gap from 2002-2005 when those bonds were not offered. Because the 10 year has continuous data since 1955, it is often used for spread analysis; weakness is that duration is not matched. The September Baa-10UST spread is also at historical highs other than spikes.


