
Measures like P/E ratios are relics of days long past. Today, we have more robust data and can more easily detect distortions. To outperform benchmarks, investors can use more meaningful measures.
When broadsheet newspapers were the source of market data, Price/Earnings per share (P/E) ratios were a one-column summary of value. The number showed how many periods of earnings per share (EPS) were needed to cover the purchase price.
Like the ink on the old broadsheets, P/Es were dirty summaries because:
- Investors don’t receive earnings; they get distributions and price appreciation
- Assumes EPS from all companies grow at the same rate
- Assumes future earnings will match history
These weren’t true then or now.
Over time, limitations of the P/E became clearer and improvements offered. For example, it helps to be forward-looking. For more on complications and improvements see, Market value – why P/E might not be what you think it is.
Yet, tweaking the “E” wasn’t enough to fix the problem. Investors still needed better insight to fundamental value. This is in contrast to traders who use P/Es for psychological or technical purposes, unrelated to fundamentals.
A step in the right direction
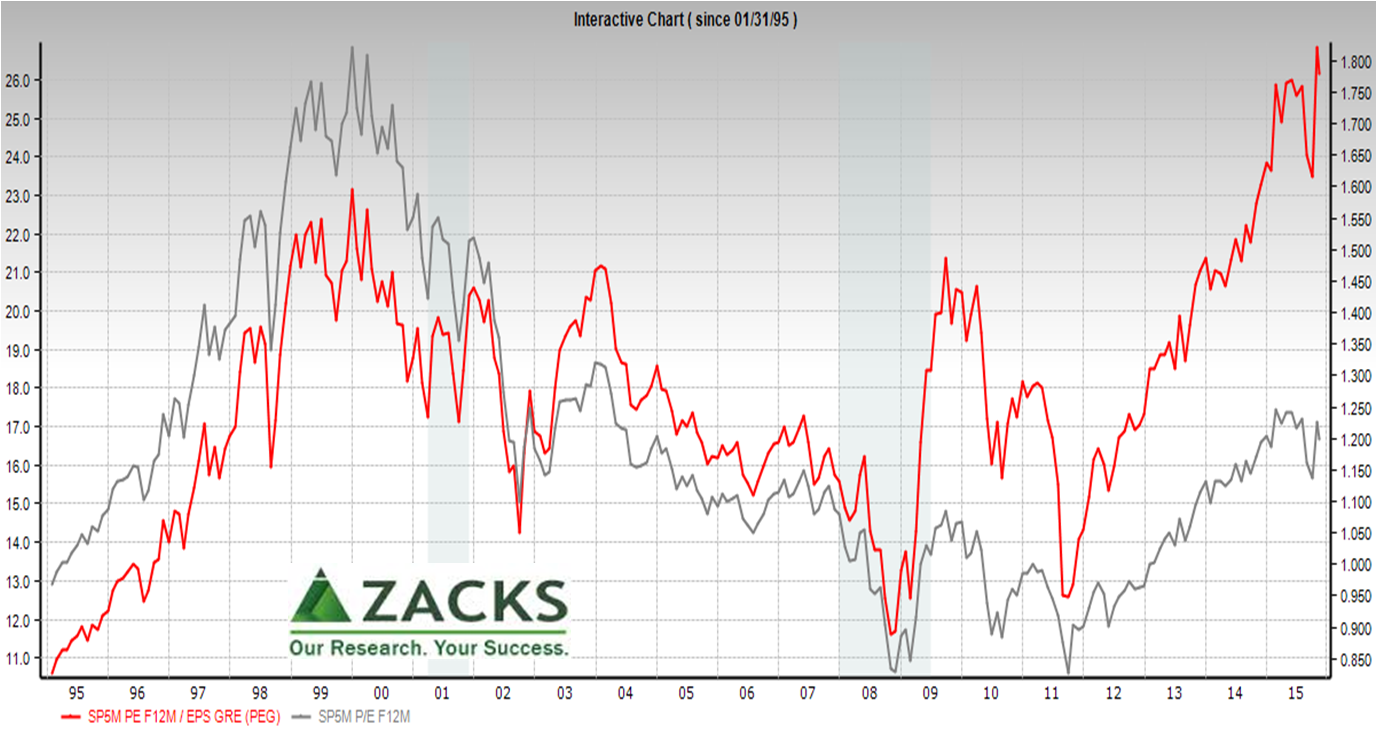
To help overcome several of these problems, the Price to Earnings to Growth (PEG) ratio was created in the 1960s. This starts with the P/E ratio and then divides it by the expected 3-5 year EPS growth rate. Yet, it still assumes a constant growth rate for each company.
The PEG is convenient to read. A measure of less than one implies analysts expect future EPS to grow faster than current EPS — thus the stock is undervalued according to its P/E.
The PEG (red line, right axis) is at a lofty all-time high. The P/E (gray, left axis) is at a 10 year high, but well below its dot com bubble peak.
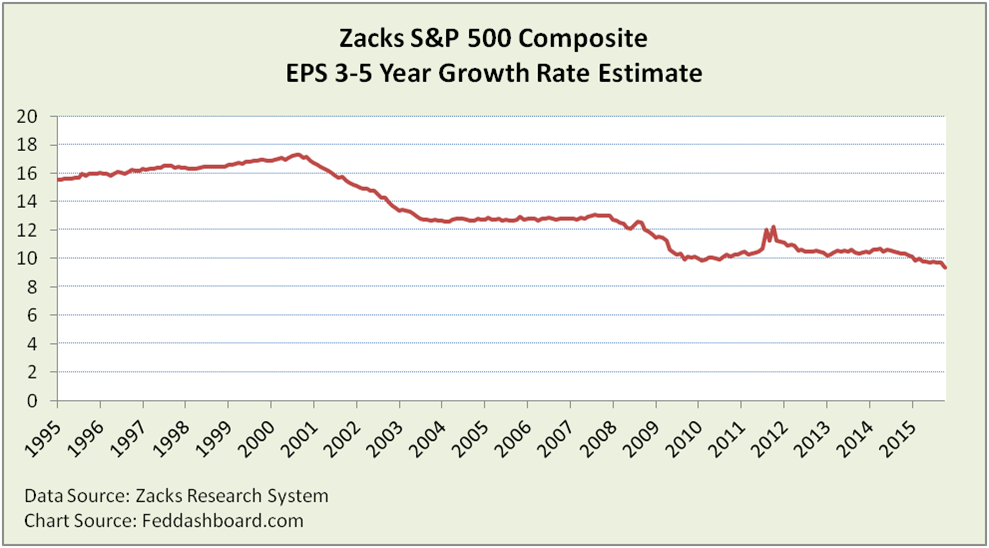
 Poking at the PEG, we uncover a reason for its all time high – low expectations of 3-5 year EPS growth, from consensus estimates that are usually bullish.
 Reconsidering return
Swapping equity for debt can reduce weighted average cost of capital. But, this also increases financial leverage risk and, by reducing shares outstanding, also affects return on equity (depending on how clearly investors value cash balances). To help overcome this complication, measures agnostic to capital structure are helpful:
- Invested capital (Long-term debt, convertible debt + non-current capital leases + mortgages + book value preferred stock + common equity)
- Enterprise or economic value (Price * Shares out + Long-term debt + Current long-term debt + Preferred stock – (Cash + Marketable securities))
Common complications
The P/E, PEG and return ratios all suffer a shared problem in comparability over time. Why?
- The “P” has been distorted by the Federal Open Market Committee’s large scale asset purchases (aka, QE)
- The “E” has been distorted by earnings engineering, including cost-cutting into innovative capability, GAAP-magic, debt-equity swaps and share buy-backs
Debt prices have also been affected by lower interest rates.
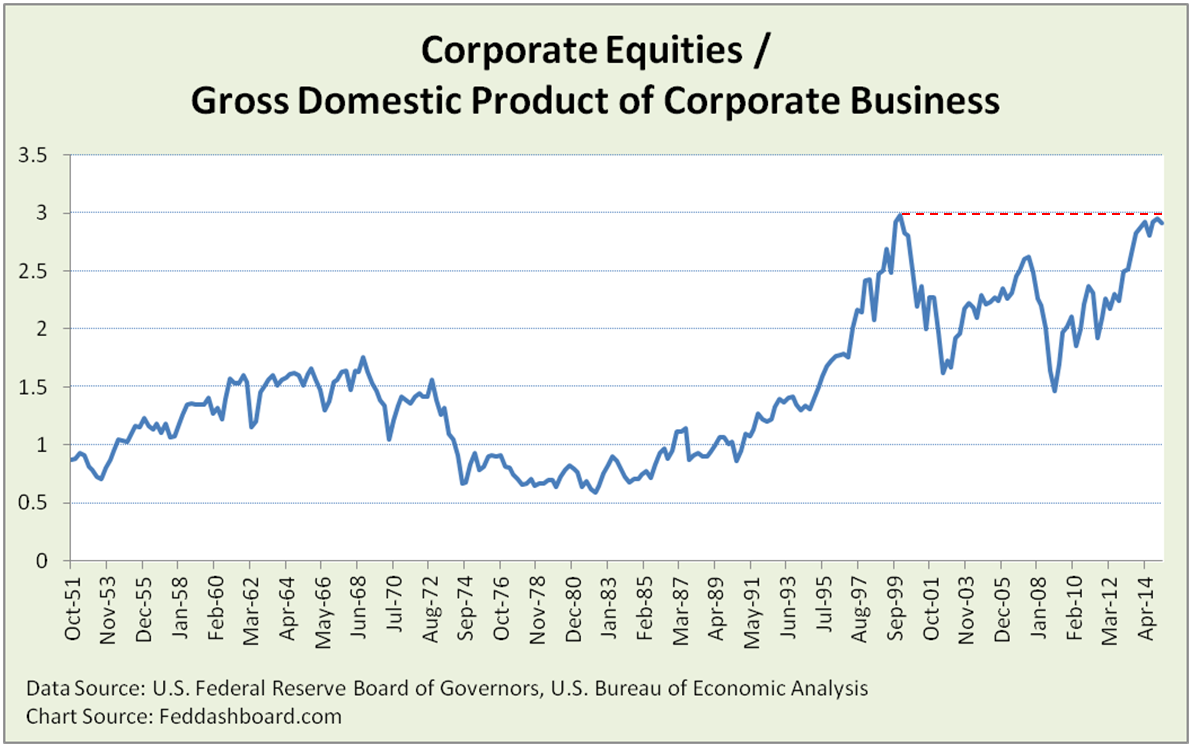
To help overcome limitations, watch business model fundamentals at the “tree” level and the Strain Gauge “forest” view. The Strain Gauge is near all-time highs.
 Bottom line: Beware of broadsheet relics
- Ratios are limited by their numerators and denominators, some are better than others for answering specific questions
- For economists feeling the P/E is only a little “elevated,” track the PEG and Strain Gauge bubbles
- For policy-makers evaluating economic strength, consider the weak estimate of 3-5 year EPS growth from usually bullish analysts
- For investors, skip the P/E, watch better ratios (such as cash and sales related) and then look beyond ratios to business model fundamentals and the 4Rs to outperform benchmarks
Data Geek notes:
- Invested Capital and Economy/Enterprise Value have varying definitions; Zacks definitions used for IC denominator and EC numerator
- Strain Gauge calculated with most recent data from 2Q2015