
Individual investors have a problem when tracking and rebalancing their portfolios. Value ratios move with more than price. There seems to be mystery pattern. What is it? It’s the saw tooth effect.
Individual investors investigating these moves quickly discover it is not:
- Shares going ex-dividend
- Earnings “surprises.” It’s no surprise that about 70% of S&P 500 members routinely beat earnings per share (EPS) estimates. Traders care about daily “surprises.” Investors with retirement or college funds care about actual trends.
A clue to the mystery is that it is more apparent in value ratios that include analyst estimates. The image of a fundamental analyst is of someone with muddy boots and a sharp pencil inspecting a company. There are excellent independent thinkers. But, how much “group think” exists among the masses?
Finding the pattern
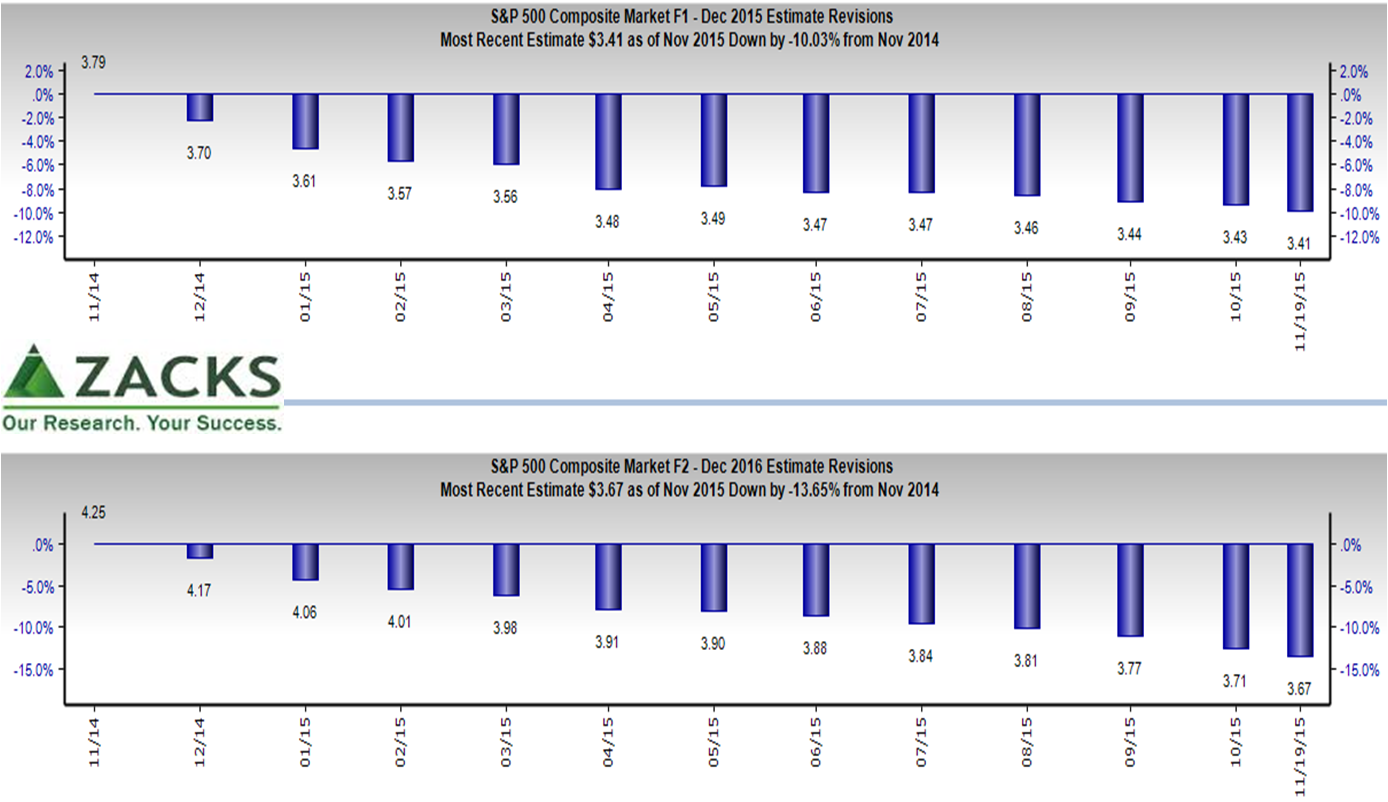
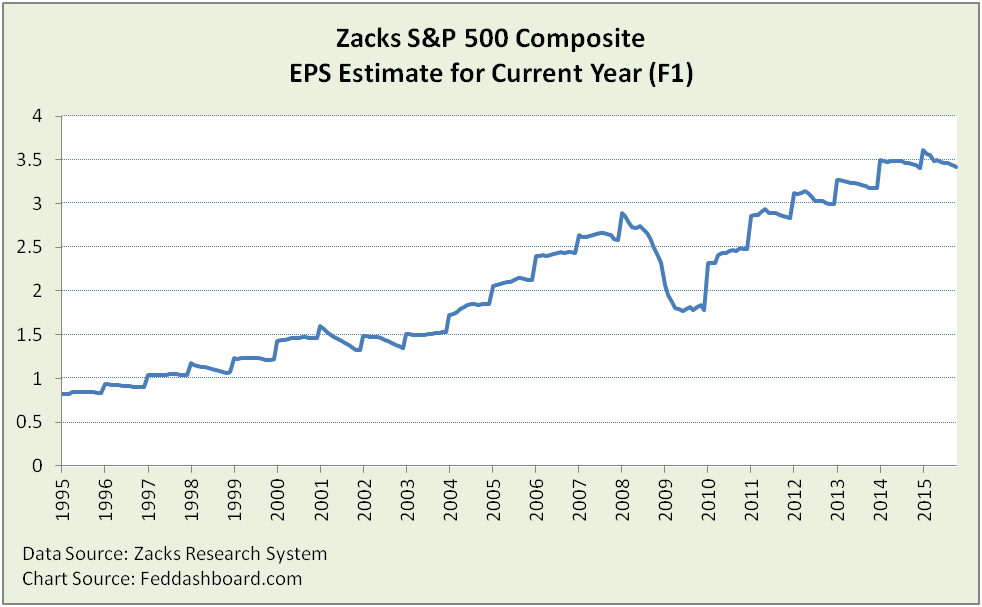
With the help of Zacks Research System (ZRS), it is a few keystrokes to discover the pattern – initially bullish revised downward. The top panel below reveals monthly revisions to the current year (F1) EPS estimate. The percentage decreases on the vertical axis are relative to the November 2014 estimate. The bottom panel is the same, but with the next year (F2) estimate.
 Are declining expectations unique to the past year? No.
Drilling down discovers the saw tooth effect. Optimism reigns at the beginning of each period. Then, it fades in most periods other than around the credit bubble.
 Seeing the saw tooth pattern requires access to the underlying specific year estimates that are organized bottom-up to the S&P 500 member companies. This detail is different from EPS estimates that are published on a 12 month forward basis. The 12 month forward view blends the current and next fiscal year, so the saw tooth pattern can be obscured.
Zacks makes the pattern easier to see because of how ZRS calculates composite proxies bottom-up. This is clearer than calculations that start with index averages.
Future view less bullish
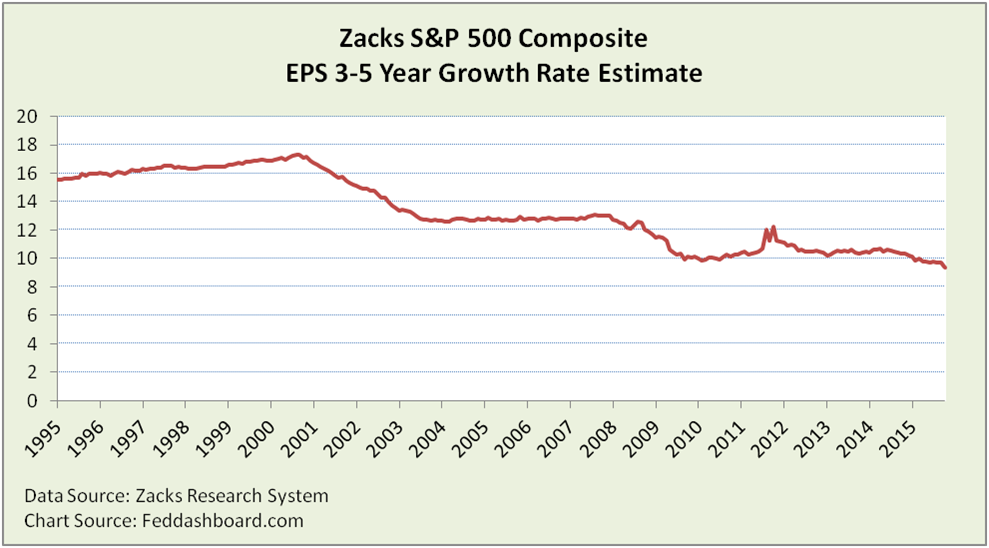
Forward EPS is used in many ratios, including Price to Earnings per share (P/E) and Price to Earnings to Growth (PEG). The PEG’s “G” is the estimated 3-5 year EPS growth rate. The PEG is near all-time highs, while the P/E is only elevated. Why?
Poking at the PEG, we uncover a reason for its all time high – low expectations of 3-5 year EPS growth, from an analyst average that is usually bullish.
 Importantly, Zacks numbers are an average of all analysts reporting. Some analysis methods are better than others. Zacks, Thomson Reuters StarMine and others identify the more reliable analyst estimates.
Bottom line: Adjust for the saw tooth effect
- In broad bets on indices or sectors, understand how averages affect ratios, use bottoms-up for clarity
- In selecting companies with analyst-driven value ratios, consider analysts with better track records
- View the low EPS 3-5 year growth rate estimate as a caution sign
- As always, understand business model fundamentals and 4Rs of value measures (Rare, Right, Reflective and Relative)