“Earnings engineering” is a problem mentioned each earnings season. What earnings are real versus just “engineered?” To avoid errors in evaluating earnings, watch three ratios: Net debt to capital, Buy-back and Earnings Pureness.
While rebalancing her portfolio, Carol noticed changes in financial ratios of similar companies that didn’t make sense given actual performance. “Earnings engineering” she realized, “but how do I spot it more easily?”
“Earnings engineering” to investors like Carol means rather opaque actions companies take to make ratios appear better without actual improvement. This is in contrast to real business model improvements trumpeted in investor day presentations or even mechanical changes such as shifting property to a Real Estate Investment Trust.
Thirteen years ago, Prudential Securities expressed long-standing concerns about IBM’s earnings engineering. This past March, BlackRock CEO Larry Fink triggered a new wave of concern.
Three warning flag ratios are especially insightful because of how they cascade through other ratios.
Three Warning Flags
- Net Debt to Capital ratio
- Share Buy-back ratio
- “Earnings Pureness”
Net Debt to Capital
When the Federal Open Market Committee drove equity prices up and interest rates down, it was natural for companies to take advantage of the situation, although adding debt might increase risk depending on overall financials. With a few keystrokes, Zacks Research System (ZRS) makes the dramatic debt change clear.
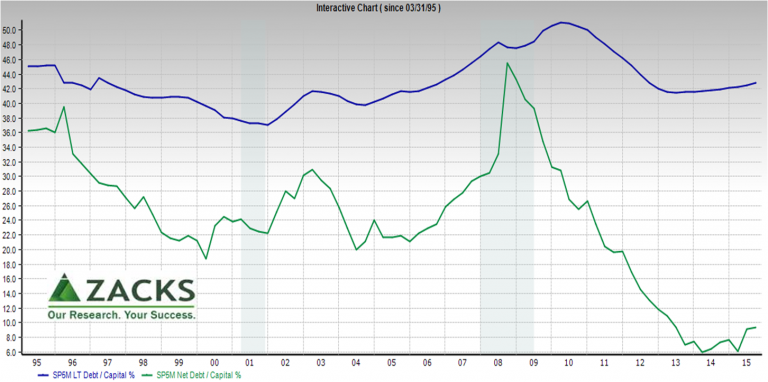
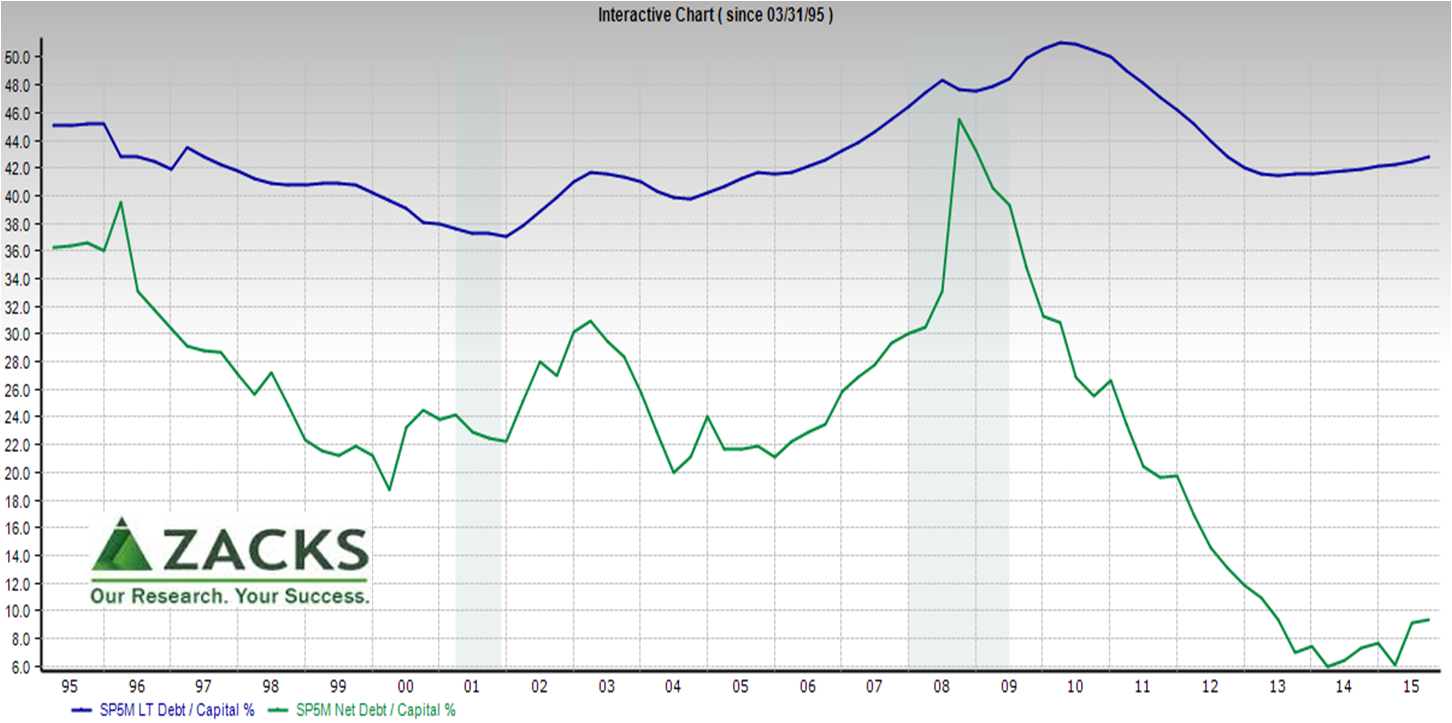 Among S&P 500 member companies, while the Long Term Debt to Capital ratio fell followed by a slight increase, the ratio of LT debt net of cash plummeted before slightly rising.
Does this average really reflect all companies?
No. Averages hide answers.
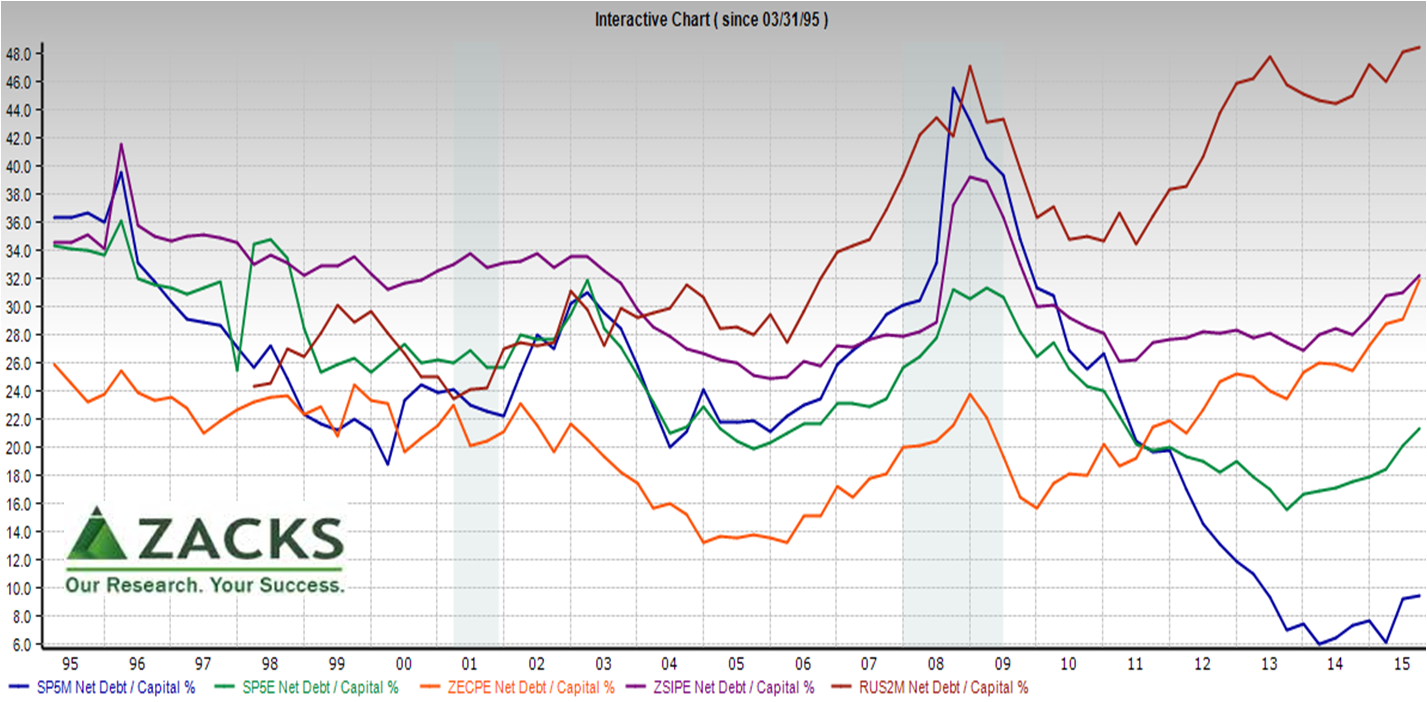
The “Captains of Cash” are so huge they pull down the S&P 500 average (below blue line). To reduce the emphasis on the largest companies, the equal-weighted S&P 500 average is shown below in green.
Zacks Earnings Certain Proxy (orange) and Standard Industrial Proxy (purple) show higher net debt levels.
Russell 2000 members (dark red) loaded up on debt without the cash of the captains. By size, Russell 2000 members are the reverse of S&P 500, the larger Russell 2000 members have relatively more net debt.
“Repurchase Yield” is the percent change in shares outstanding from four quarters ago; a negative number means net share decrease. Left axis is percent change in shares outstanding, with red line highlighting zero. S&P 500 is green line and Zacks Earnings Certain Proxy is in orange.
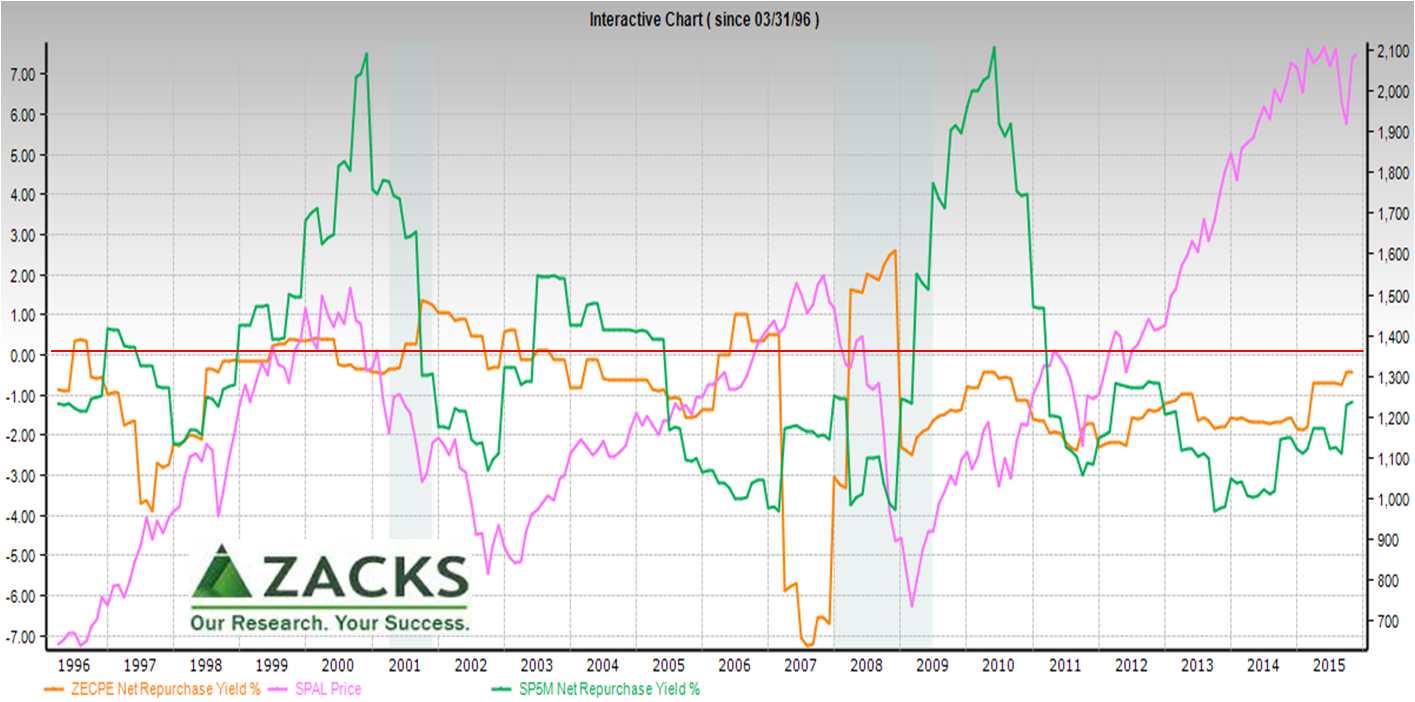 Right axis measures S&P 500 Price Index (pink) to illustrate that, contrary to Finance 101, companies aren’t always buying-back shares when prices are low – too often when prices are higher. Lower number of shares outstanding improves earnings per share, while consuming cash to do so.
“Earnings Pureness”
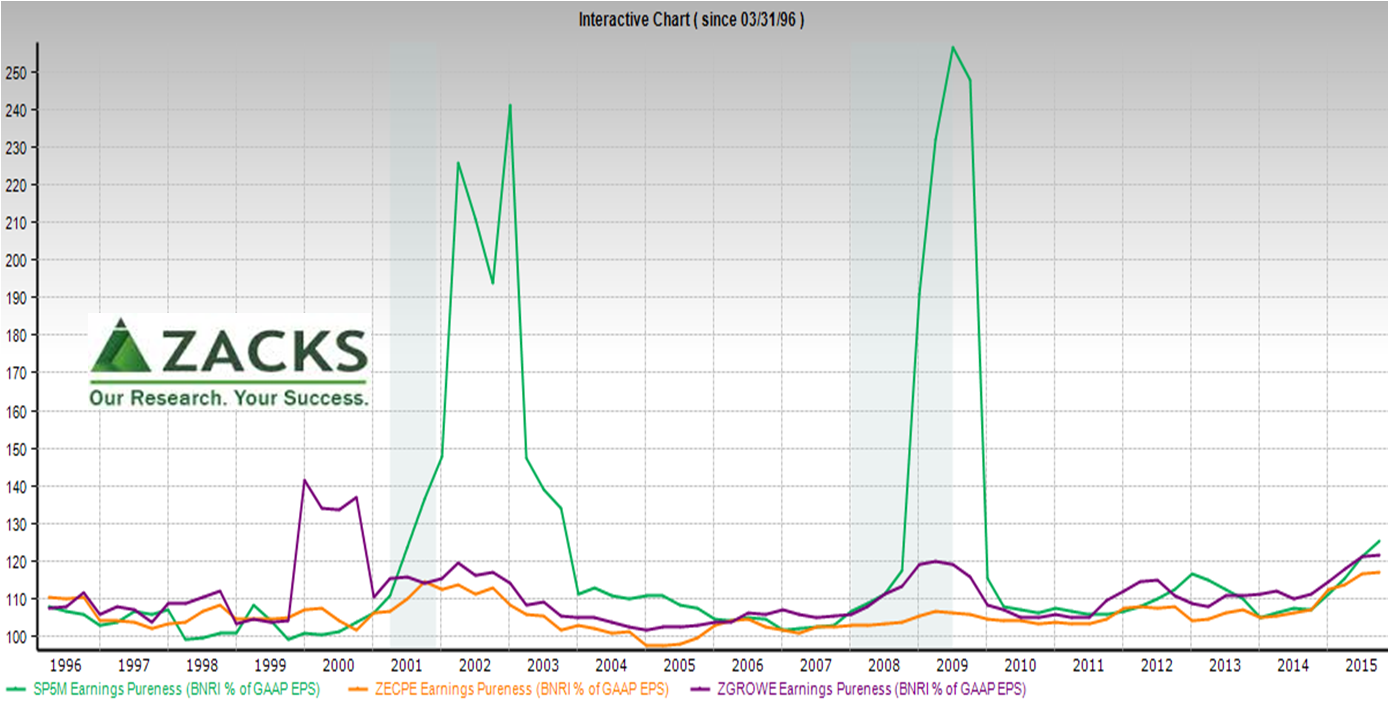
Zacks “Earnings Pureness” is the ratio of Earnings before Nonrecurring Items (discontinued operations and extraordinary items) to GAAP earnings. The higher the Earnings Pureness ratio, the more expense was subtracted in nonrecurring items.
- S&P 500 overall is in green
- Zacks Earnings Certain Proxy (orange) and Zacks Growth Proxy (purple) have less variation
- Zacks Industrial and Cyclical, and Russell 2000 proxies have spikes up and down so large they don’t fit on the same chart
The ratios shown have doubled since mid 2014 — a flag to find the cause in individual companies.
 How to find the cause in individual companies? A convenient approach is to start with DuPont Analysis ratios and drill down. For example, this is the Valuation Ratio page for widely-held IBM:
Edge in information
For Carol and everyone, earnings engineering is a problem.
- There will always be some because of the practical need for discretion in GAAP
- Avoiding the bigger pitfalls of engineered earnings comes from visibility to disclosed data
- Better investors get their edge through easier access to insight from information

