
Harm in headlines and sound-bites is when a real story is hidden and people make poor decisions. For example, recent coverage of a slight upturn in Personal Savings Rate confused the real story of consumer health and potential effects on year-end shopping.
Sound-bite: “Personal Savings Rate at a multi-year high.” True or false?
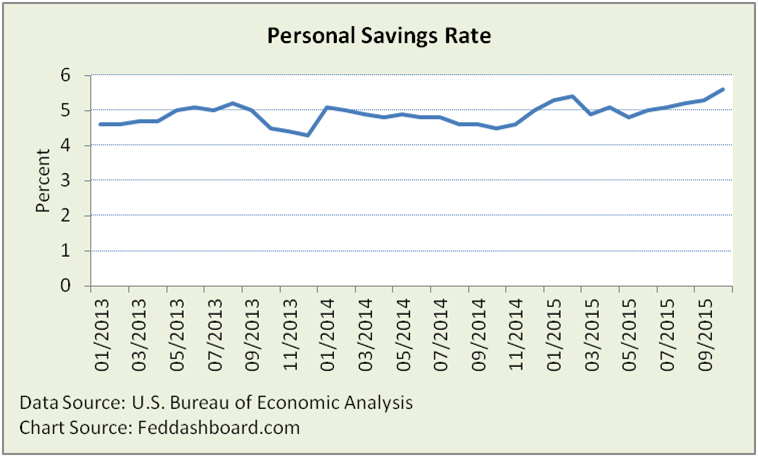 The Rate is at a high since January 2013, for 22 months. So, true…
Is that the whole story? No.
You can take 3 steps to discover the rest of the story.
Step 1: Check history
Personal Savings Rate is at lows since World War II other than run-ups to the dot com and credit bubbles.
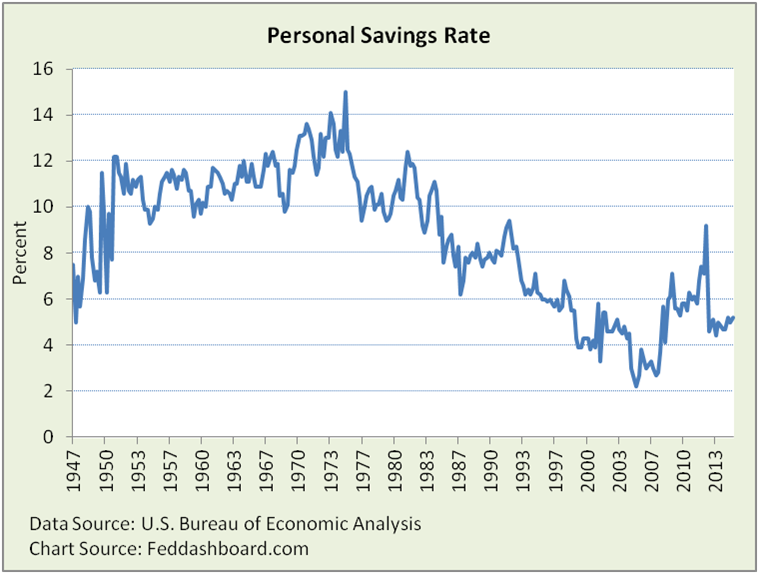 More data points make clear the short term view gives a false impression. The longer term view also provides a better lens for viewing year-end retail sales.
Click on the LIVE DASHBOARDS menu button to see the full history for many measures. Each chart can be clicked for more data views.
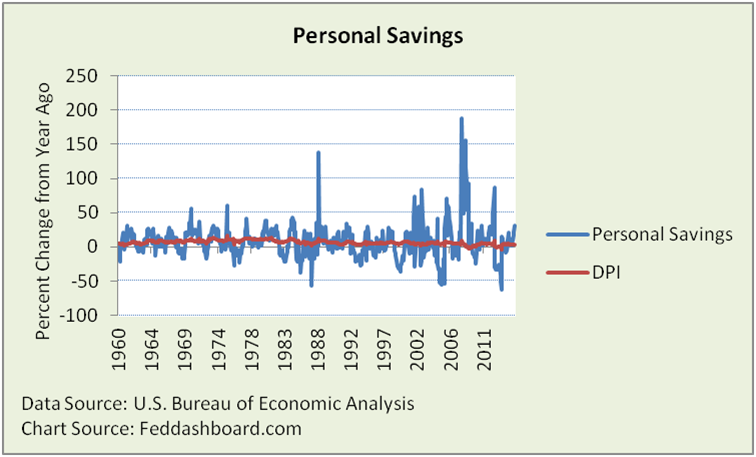
Step 2: Break it down
Which part of the ratio drove the move? Personal Savings Rate is Personal Savings divided by Disposable Personal Income (DPI). DPI is personal income after income taxes; not to be confused with “discretionary income.”
In this view, clearly DPI is more stable than Personal Savings.
Notice the rise and fall pattern in Personal Savings, October was 30.7% higher than a year ago. A financial market technical analyst might say that after the current run up, Personal Savings is due to drop. Or, fear could drive it higher.
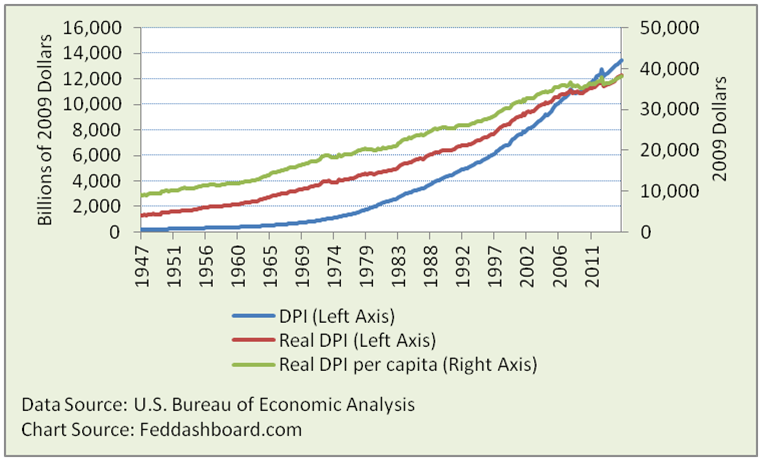
 Step 3: Confirm comparability
Over time, prices and population change. A new baby increasing household purchases is different from existing household members increasing purchases. Higher prices for houses are not the same as more houses being built.
Adjusting for changes matters more or less depending on what is in the ratio. For example, when a nominal number (not adjusted for changes in price level) is divided by another nominal number, then price level changes are roughly cancelled out into a “real” (price level adjusted) ratio.
To illustrate the magnitude of price and population changes, let’s focus in on DPI. The unadjusted DPI appears to grow quickly. Adjusting DPI for prices and population shows more modest growth, especially after 1972.
 In financial markets, a comparability problem is seen in the Price/Earnings ratio where price was pushed up by Federal Reserve action and earnings have been increasingly engineered.
Bottom line, too many poor decisions have been made by confusing headlines with reality. Three steps help discover insights and avoid bad decisions.
Data Geek Note: Personal savings is not a direct measurement; it is DPI less Personal Consumption Expenditures.