When was the last time you received a check for Earnings per Share (EPS)? Never. Five reasons illustrate why EPS is over-hyped and contributes to short-termism.
What do investors actually receive? Generally, it is price appreciation and dividends (including capital gains).
Given this, why does EPS matter? A common reason is that EPS looks ahead to price appreciation and dividends.
How true is that? Clicking around Zacks Research System (ZRS), we can investigate.
- EPS engineering
EPS is sales minus all costs and then divided by shares. When EPS moves, the key question is, “Why?”
Because EPS is so hyped and affected by many factors, it is susceptible to “engineering” as described in “Three errors to avoid in examining earnings.”
- Dividend diversion
For dividends, a rule of thumb is dividend payout rate of 50%. The thought that EPS points to the next dividend or capacity to pay dividends has intuitive appeal. Suzie’s lemonade stand must have profit to pay dividends to investor mom. But how strongly does this hold?
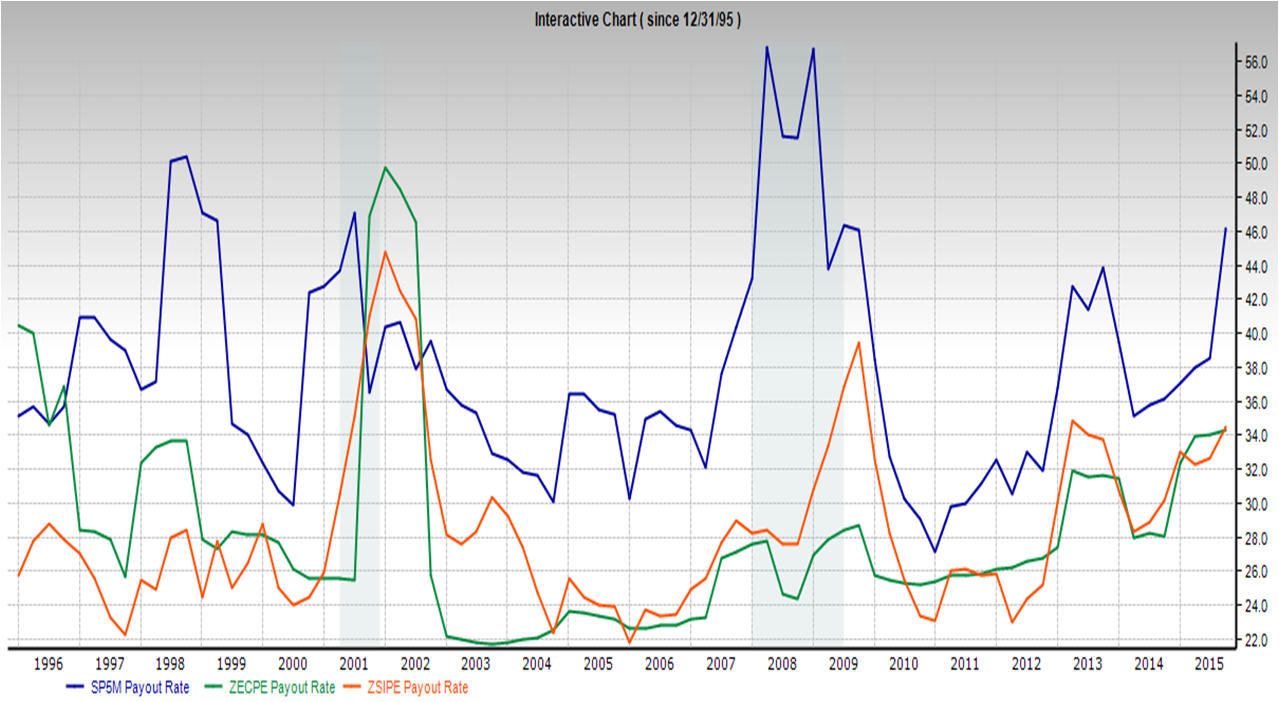 For S&P 500 members (blue line), it varies from 27% to 57%. Zacks Standard Industrial Proxy (orange) is more stable with typical variation from 22%-30% plus spikes. Zacks Earnings Certain Proxy (green) focuses on highly stable companies that produce consistent earnings, these companies also have a more stable dividend payout ratio. All reflect higher post-crash dividend payouts as companies have cost-cut and struggled to invest in growth.
In the dividend context, the best argument EPS matters might be that for S&P 500 members, EPS 5 year growth rate is statistically related to 10% of the dividend 5 year growth rate (R-squared 0.103).
But, if an investor wants reliable dividends, then why tease through fluctuating dividend payout? More directly use ZRS to find safer dividends in three steps.
- Growth investment struggling
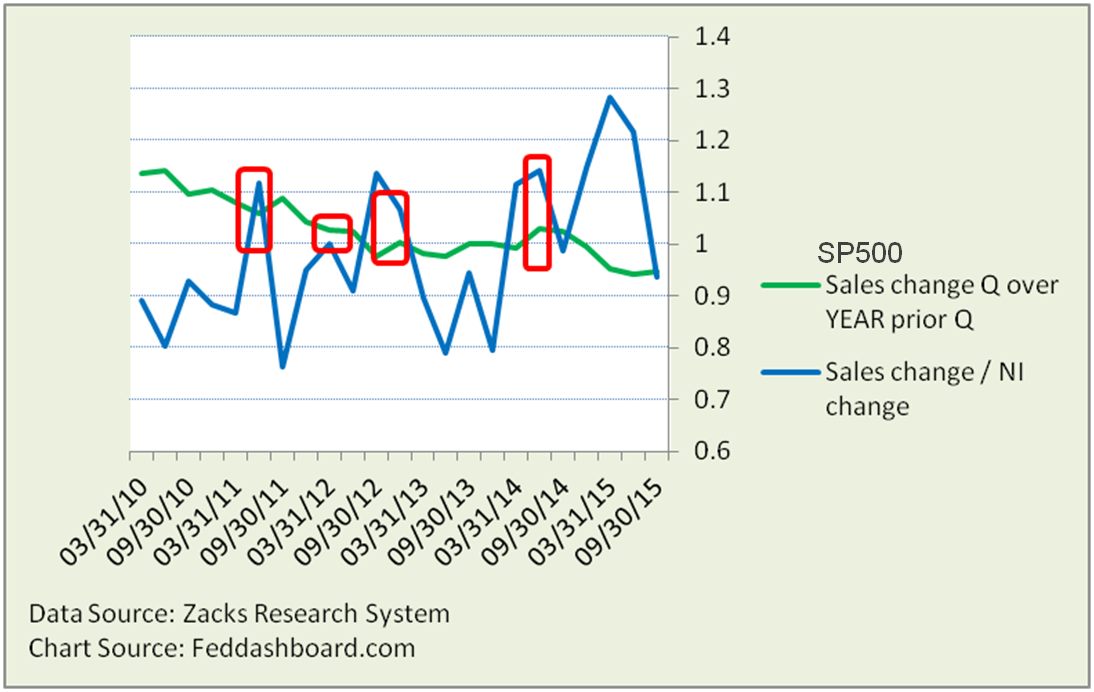
If not paying dividends, companies can use earnings for a cash hoard, share buy-backs or investing to drive sales growth. The sales growth relationship is seen in Sales change divided by Net Income change. In only 4 of 22 post-crash quarters have both Sales change and Sales change to Net Income change been positive. In the past year, a stronger U.S. dollar weighed on sales.
- Pale price performance
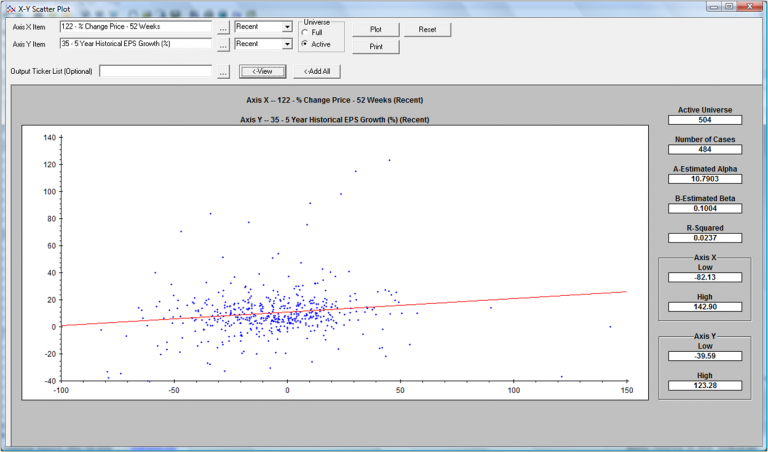
To picture EPS 5 year percent change and 52-week share price percent change for the most recent quarter, the ZRS screener X-Y chart is used.
 EPS 5 year percent change is related to 2.4% (R-squared 0.024) of share price percent change. EPS percent change from same quarter year ago is related to only 1.4%. Endurance matters.
- Total Shareholder Return is tenuous
However EPS is used, the benefit should be received in Total Shareholder Return (TSR, price appreciation plus dividends).
In a TSR context, the best argument that EPS matters is the tracking of EPS 1 year percent change (green line) with TSR 1 year percent change (orange). Because they snake roughly together they have a relatively high historical correlation.
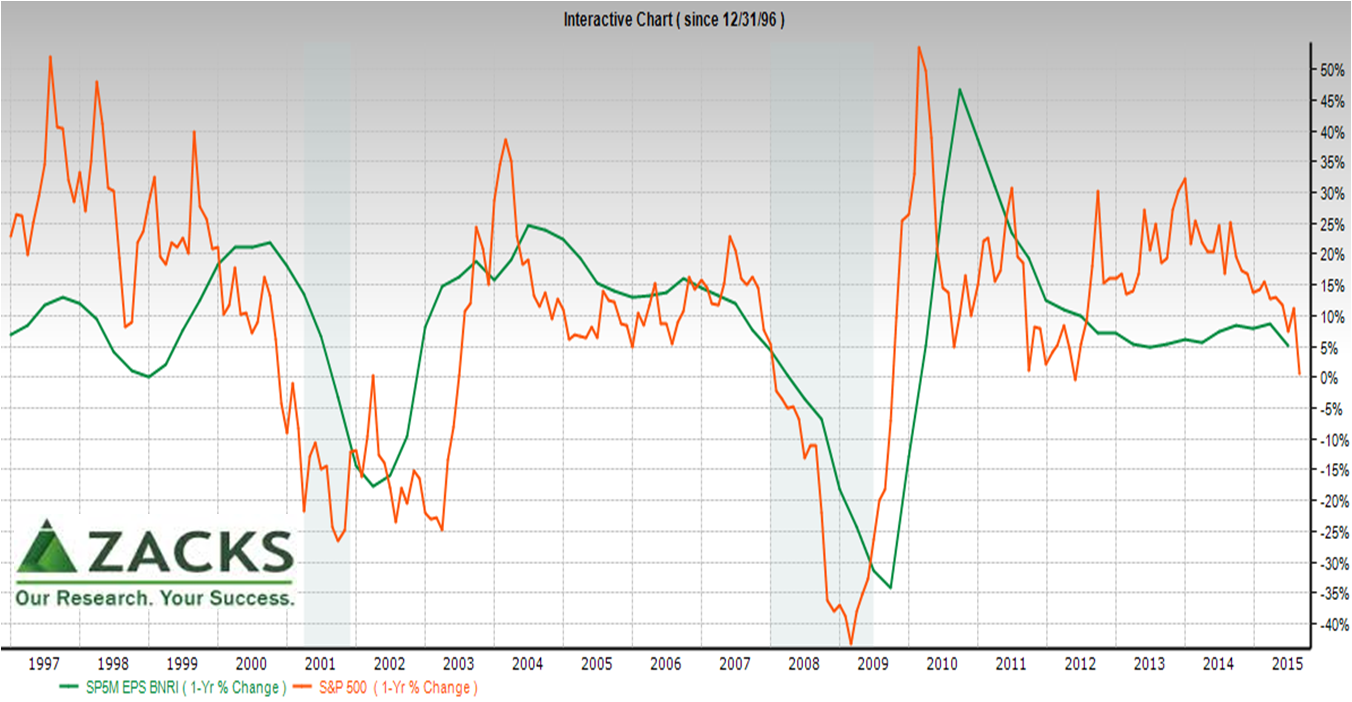 But, look closely — notice shifts in both the lead-lag (relative side-to-side) and magnitude (relative up-down). These “shifting snakes” are why EPS’s predictive power is much lower than at first glance.
More, in each of 5 post-WWII periods, just one economic indicator was related to over 90% of S&P 500 performance. For example, from mid 2012 to late 2014 notice how the Federal Open Market Committee drove TSR (mostly price) growth far above EPS.
Perspective in the portfolio
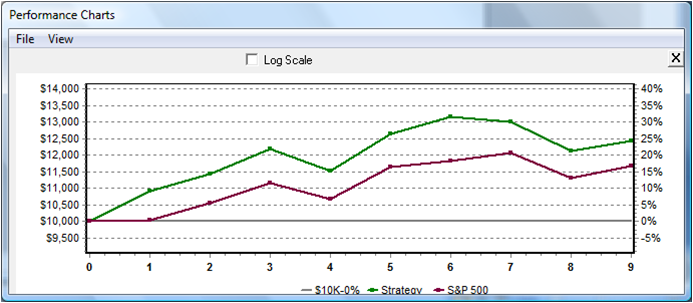
Ultimately portfolio returns matter. The portfolio picture comes from the ZRS back-testing tool. ZRS has many parameters; we’ll set four – 2 year test (longest available), S&P 500 members, 12 week rebalancing as EPS is quarterly and a target portfolio of 30-50 companies (common to fundamental investors).
- Portfolio: 41 companies in the period starting 11/15/2013, rising to 46 then dropping to 26 companies.
- TSR: 24.3% versus 16.7% for benchmark.
- However: Most of excess — 8.7% — is from the first period. The EPS strategy was up in 6 of 9 periods compared to 7 of 9 for S&P 500 benchmark.
Compare and contrast
- Zacks ratings outperform an EPS-only strategy. Following Zacks “strong buys” with twelve-week rebalancing yielded 35.9% (portfolio size 7 to 26). A four-week rebalancing (closer to the “shelf life” of ratings) yielded 45.8%, up in 20 of 27 periods, compared to the S&P 500 benchmark of 16.8% up in 15 of 27 periods.
- Business model-based investing farther outperforms. With only semi-annual rebalancing, a business model-based approach (just rule-based screen, before human adjustments) yielded 46.7% versus 12.9% for the S&P 500 benchmark.
Bottom line:
- Investors don’t receive EPS. EPS only matters if it is a reliable indicator of tangible returns.
- Share buy-backs don’t foster growth.
- EPS hype is a contributor to short-termism that weakens companies and economies.
Business model-based investing is more thoughtfully selective and avoids measures on which quant/beta funds compete furiously.

