
S&P 500 member revenue for 3Q2015 was flat from the prior quarter and down 5% from the same quarter a year ago. Some of the drop is explained by the stronger U.S. Dollar and some by specific price changes. Because effects vary by country and product, it matters how the puzzle pieces are assembled.
To more clearly see the picture of company stock values and economic health, 3 steps help fit the puzzle pieces together.
- Revenue comparison period
Compared to the prior quarter, revenue was flat. Compared to the YEAR prior quarter, revenue was off 5.5%. Period choice matters.
Prior quarter is appropriate to avoid influences of significant business change (e.g., M&A) before the immediate prior quarter. But, it is complicated by seasonality and annual operational cycles (e.g., inventory build ups). Both periods are susceptible to changes in input and output prices, exchange rates and more.
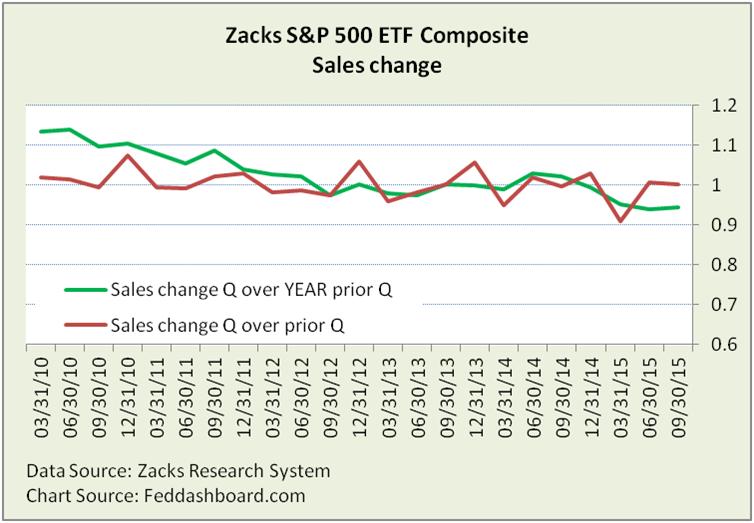 As these are aggregate averages, it’s helpful to count the number of S&P500 member companies that are “sales submarines” with quarter over year prior quarter sales decreases. Comparing 3Q2015 to the year prior quarter shows 47% of companies are sales submarines — more than 30-33% of recent quarters.
- Product price changes
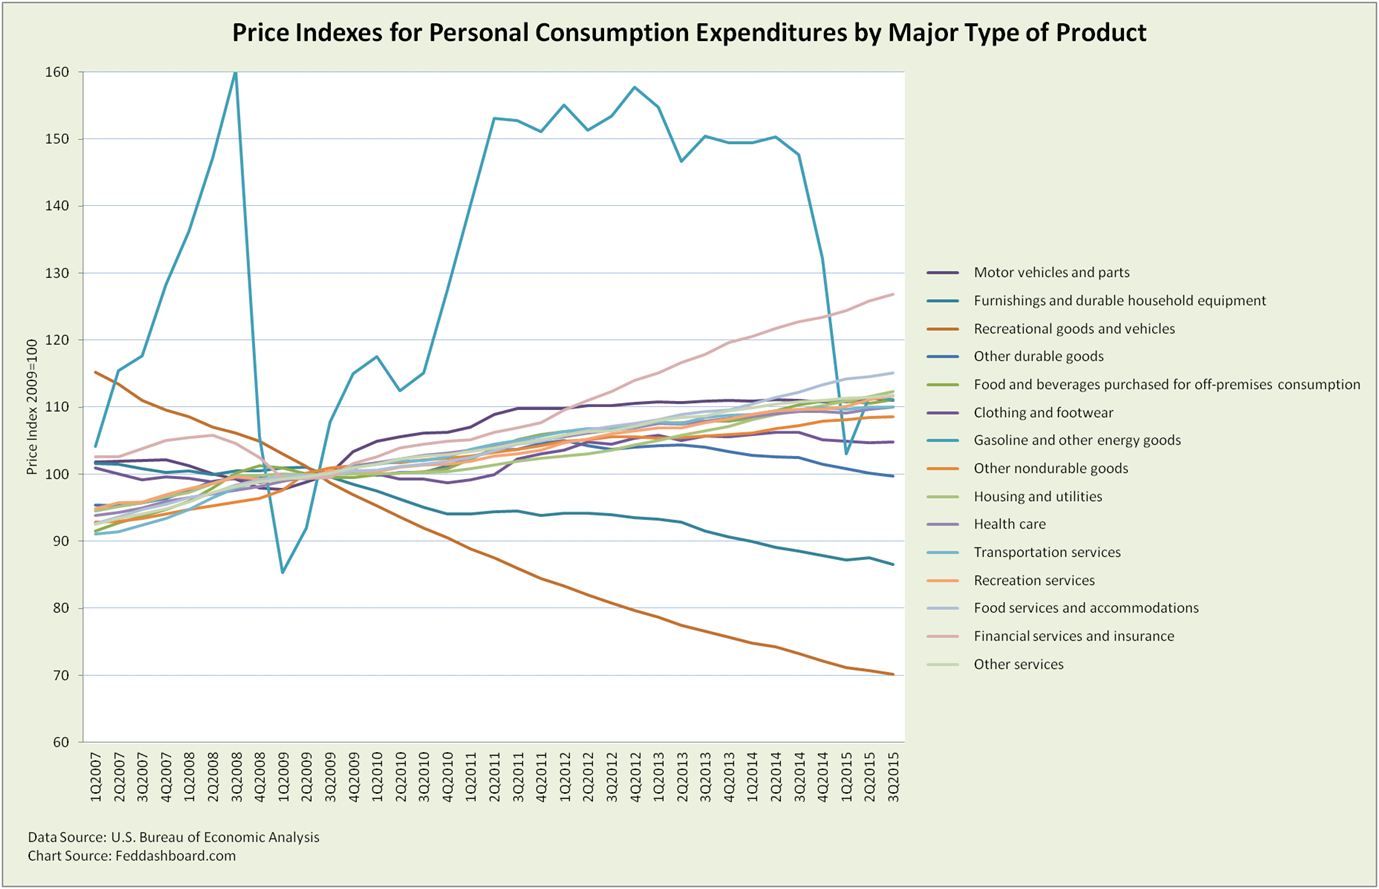
While general prices – “inflation” have been flat, individual product prices vary widely (creating the Fed’s inflation trap). Thus, company revenues need to be adjusted for their product price changes, not general inflation.
The big story has been gasoline prices. Financial services and hospitality rose more than others. This was countered by lower prices in recreational goods (including consumer electronics), furnishings and durable household equipment, other durables (led by games, toys and personal care electrical appliances), and clothing and footwear. More specifics are available from the U.S. Bureau of Economic Analysis (BEA) and U.S. Bureau of Labor Statistics (consumer and producer prices).
- Exchange rate changes
To more easily navigate country exchange rates, the U.S. Federal Reserve Board publishes the Trade Weighted U.S. Dollar Index. Over the past year, this rate has risen 15.2% against all important trading partners (termed the “Broad” index). The real (inflation adjusted) Broad Index rose 13.4%. Much of this increase has been due to monetary policy speculation.
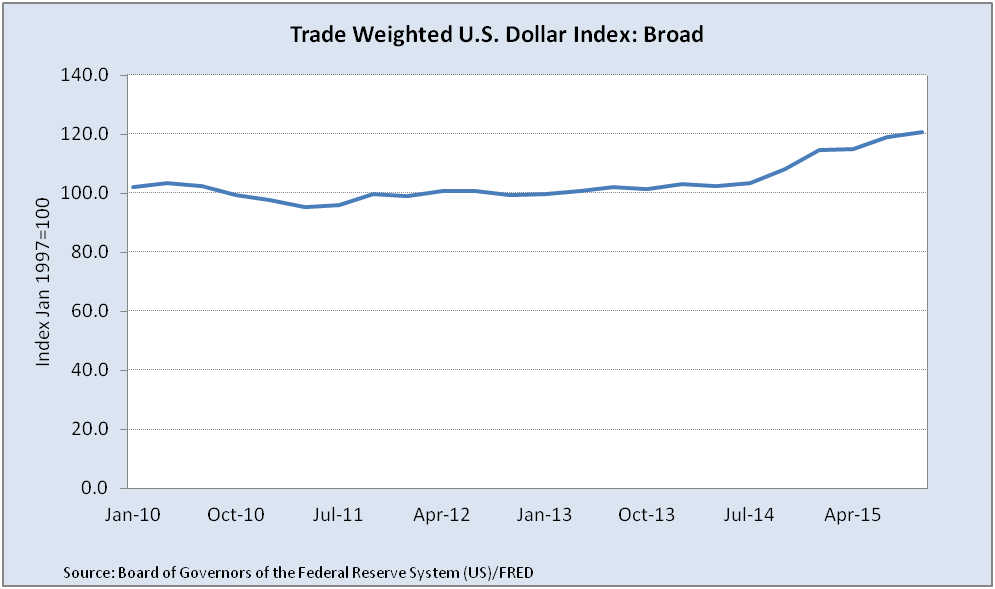
Does this mean the lower S&P 500 revenue can be adjusted up by the real 13.4% (or unadjusted 15.2%)? No, because not all revenue is international.
How much revenue is international? Howard Silverblatt, author of the S&P 500® 2014: Global Sales Report (released July 2015), writes:
- “The overall rate for 2014 was 47.82%, up from 46.29% in 2013 and the 46% rate from each of the prior four years (2009-2012).”
- “Still, over half of S&P 500 issues did not report sufficient information to facilitate producing a complete report on global sales. Of the issues that did declare foreign sales, 46.4% of them used a term similar to “foreign country,” giving little breakdown of the area or country of the sales.”
Assuming, at an aggregate level, S&P 500 member trade patters matched the U.S. average (reasonable assumption) and assuming the partial data reported by S&P members in 2014 reflected all members for the past four quarters (uncertain as Mr. Silverblatt makes clear), the 5.5% quarter over year prior quarter decrease, becomes a 0.5% increase (1.4% if using the unadjusted Broad Index).
Beyond aggregate averages, all bets are off at the company level.
Technology Twist
The post-crash revenue trend is rather sullen (green line, first chart). Yet, to the extent revenues are receiving exponential technology ripple effects, the real output (and price-adjusted) picture is brighter. Bad news is companies don’t systematically report needed data to investors. Good news is BEA estimates provide insight at the industry level.
Bottom Line:
- Sales are the vital “ring the register” measure of company health, similar to GDP for countries
- Typical headlines frequently confuse how puzzle pieces fit together
- Averages hide answers
To understand growth, start with three steps: comparison period, product prices and exchange rates