
A sluggish stock market is a stock pickers market. Finding opportunity in 2016 is a step-by-step process starting with the big picture in stock scatter plots.
Finding opportunity starts with the simple realization that equity markets are not a monolith. Averages hide answers. The easiest way to bust the myth of the monolith is the view through scatter plots, as with Zacks Research System (ZRS).
What axes to plot? As we wrote in “Five reasons Earnings per Share is over-hyped” no one gets EPS. Investors receive price appreciation and dividends. Those create the basic plot.
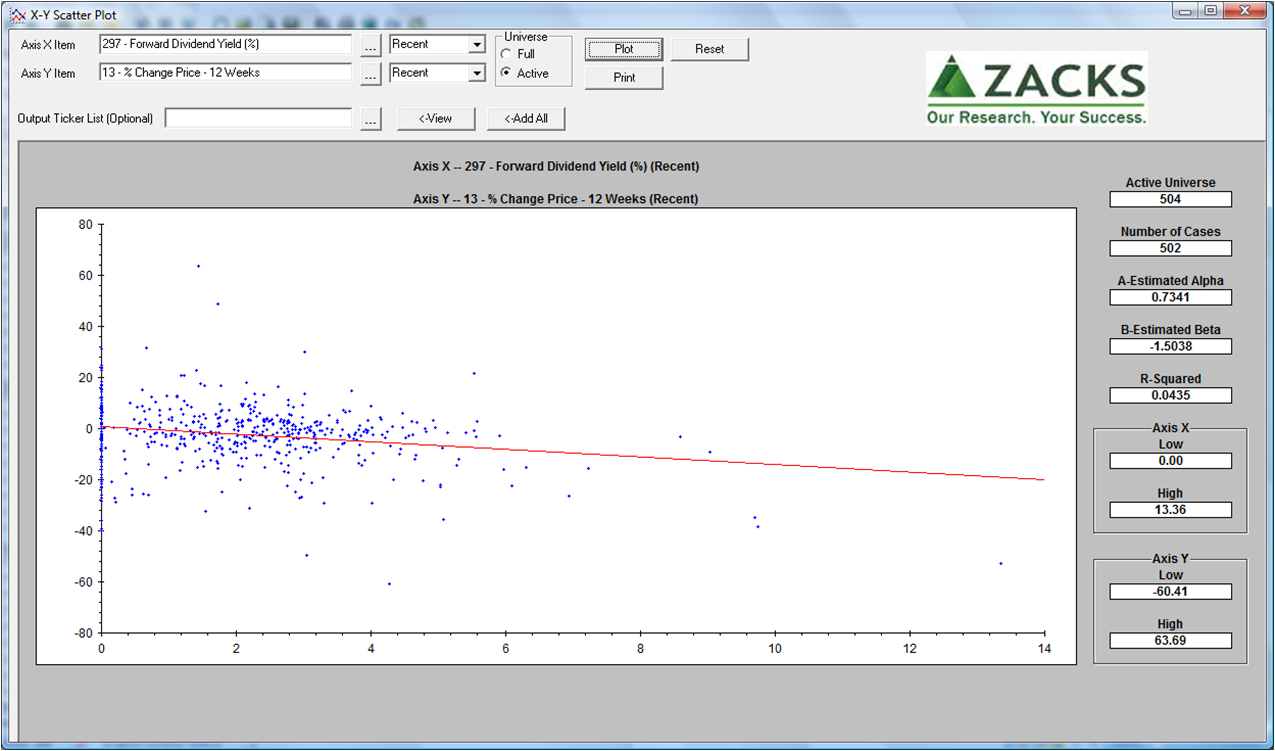 With this picture, investors can “buy the dots” with their preferred combination of price appreciation and dividends. Stocks with only price appreciation are on the vertical axis.
Sounds good, but what about risk that a dot doesn’t stay in place over time?
That’s the risk of stock picking versus buying market aggregate averages. But, in both approaches, there are no guarantees or assurance.
Aggregate average Exchange Traded Funds (ETFs) put you in the middle of the herd – still with risk. But, why stay exposed to the dogs of the scatter plot?
Surely, some dogs can be thrown away. Yes, and that’s the point of so called “smart beta” funds.
The smarter a fund gets deleting dogs, the more it becomes a fundamental, alpha stock picker. This brings us back to our premise; a sluggish market is a stock pickers market.
Thus, the risk minimizing question is how to pick the dots (stocks) more likely to stay put or improve.
To help answer this question, use plots that show endurance. Below, the price growth period is lengthened to one year and shown relative to S&P 500. Forward dividend yield is replaced with five year dividend growth.
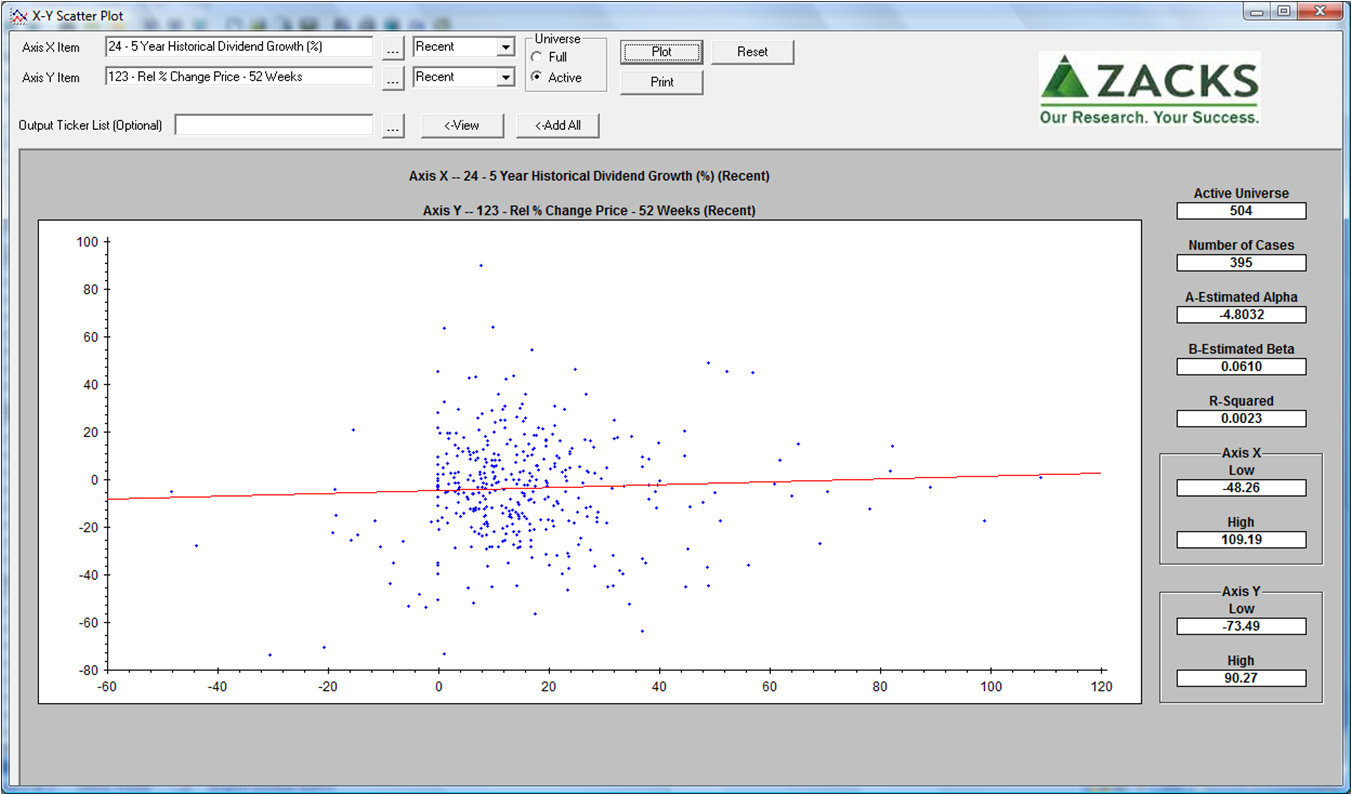 As described in “Three pointers to safer dividends,” ZRS can plot multiple measures that should be used together to highlight paths. This way, it is possible to pick stocks with, say, both better price appreciation and dividend yield than the S&P 500 benchmark.
Uncovering styles
Do these plots seem similar to fundamental investing styles (growth and value)? Yes, because these plots are of the underlying measures of those styles.
“Growth” and “value” definitions vary, in general:
- “Growth” is about: a) price appreciation faster than average; and/or b) herd sentiment not fully understanding a company’s growth engine. Risks include sustainability (especially for newer companies) offset by hopefully less cyclical exposure.
- “Value” is about: a) expected price appreciation correction from lows due to herd sentiment or shock events that caused a price to be low compared to true/fair/intrinsic price; and/or b) higher than average dividends. Risks include: an investor’s calculation of true price is too high, and higher dividends are due to management insufficiently investing to maintain sales and cash flow trajectory.
Myth busting
Both growth and value styles challenge Price to Earnings (P/E) ratio as we discussed recently in “To find better measures of value, look beyond broadsheet relics.”
- Growth style says “P/E as a ratio doesn’t reflect differing company growth rates.”
- Value style says “The market herd stampedes too fast to see key company information, so herd miscalculates ‘E’ thus sells down the ‘P’ thus provides opportunity for smarter buyers.”
Because both styles see structural mispricing and opportunity from superior insight from public information, both deny the efficient markets hypothesis.
Where the reveal gets juicy is uncovering more reasons for structural blindness to opportunity – a topic for future analysis in this series.
Of course, we view all this through the lens of our “bubble bursting” and “slow leak” warnings from October 2014, today with higher priority on geopolitical risk.
Bottom Line (for now)
- Sluggish market is a stock pickers market
- Scatter plots are the starting point for spotting opportunity