
U.S. REITs are often seen as a safe haven by domestic and international investors. Are they still safe when fundamentals are strained? Trends in REIT price and real estate markets have investors reevaluating risk.
How high can Real Estate Investment Trust (REIT) prices go and/or how soft can real estate fundamentals become before REITs get risky? Because REITs were good investments at times in the past, are they still today?
In return for their money, investors receive price appreciation and dividends. As we discussed in “Dividends in danger? Avoid 3 mistakes.,” dividend health in asset-based investment vehicles needs to be evaluated based on asset health (both earnings and asset condition).
Funds flowing into REITs are not necessary a good sign (other than for momentum traders who are also quick to jump out) if revenue, cash flow and dividends don’t keep up with price.
Let’s look at the data for the six REIT sub-industries used in Zacks Research System (ZRS):
- Two phases: Development and Operations
- Three market types: Retail, Residential and Other (Non-res, non-retail)
- Mortgage Trusts
For the price picture, we’ll focus on three REIT types.
 Looking at price growth since October 2009, distinct phases are tied to monetary policy: rounds of Quantitative Easing (QE), taper tantrum May 2013, end of QE3 fall 2014, plus Brexit and Trump bump. In addition to U.S. funds flows, they reflect QE asset purchases and global flows seeking safety. Mortgage Trusts (not shown) have struggled longest. S&P500 (black line) is included for reference.
Since fall 2014, only Retail REITs have increased in price. Residential and Non-residential, non-retail decreased least at about -6%.
Still, many investors are willing wait out decreases in the hope the real estate prices will recover. They especially take hart that Non-res, non-retail and development stage REITs have only modestly increased in price compared to the start of the housing bubble in the 1990s. Lower prices are good for buyers it if means price compared to fundamentals is more reasonable.
REIT investors tend to look most for price and dividend safety, so let’s look at dividends per share (DPS).
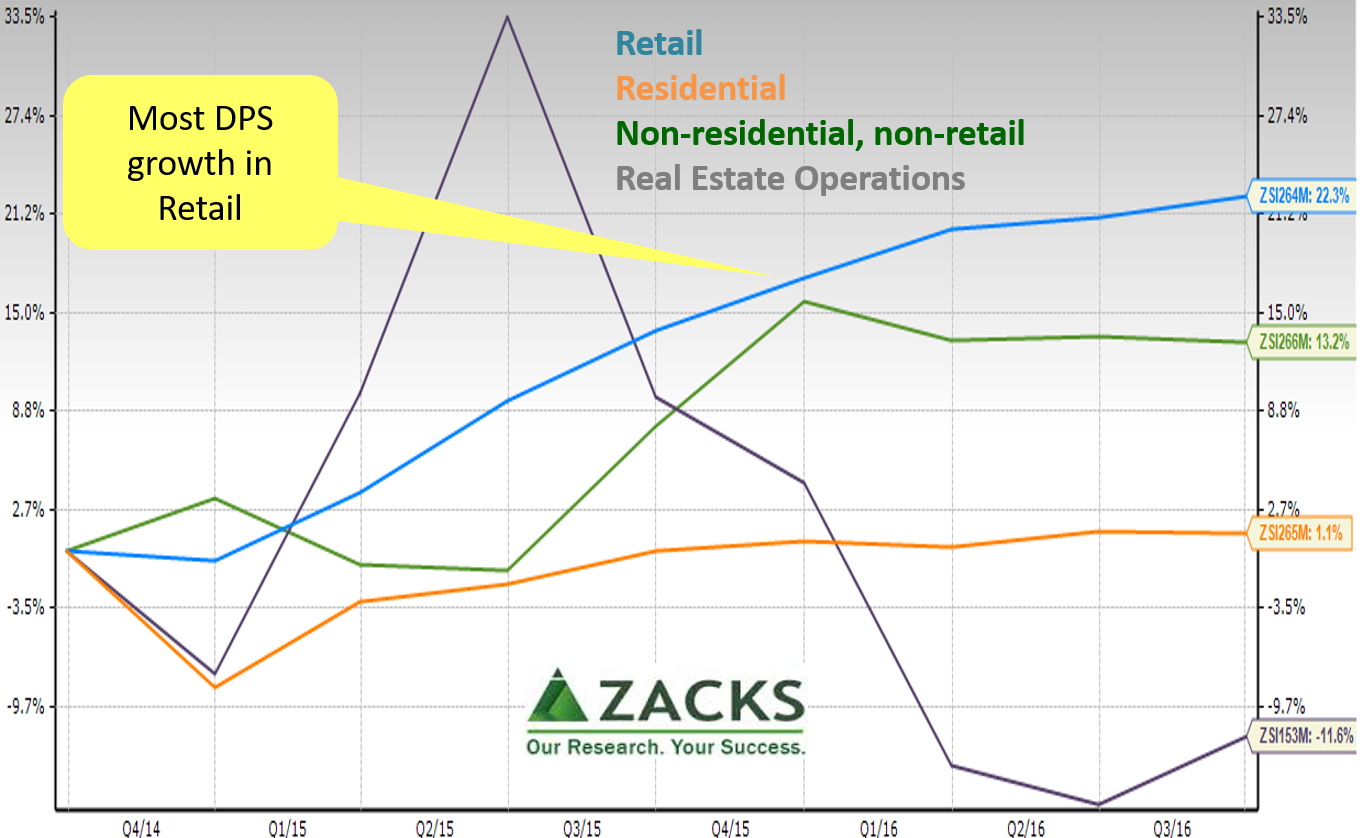 Since 3Q2009, Residential REITs have been under the most pressure; Non-residential, non-retail (“Other” in ZRS) have done the best.
Post-QE, Retail REITs have performed best in both dividend yield and dividends per share (DPS). DPS are more relevant for someone making a hold decision because yield can increase just due to falling prices.
The next view shows the raw (not percentage) change per year in DPS for each REIT sub-industry. Since 2011, Retail and Non-res, non-retail have been the most stable.
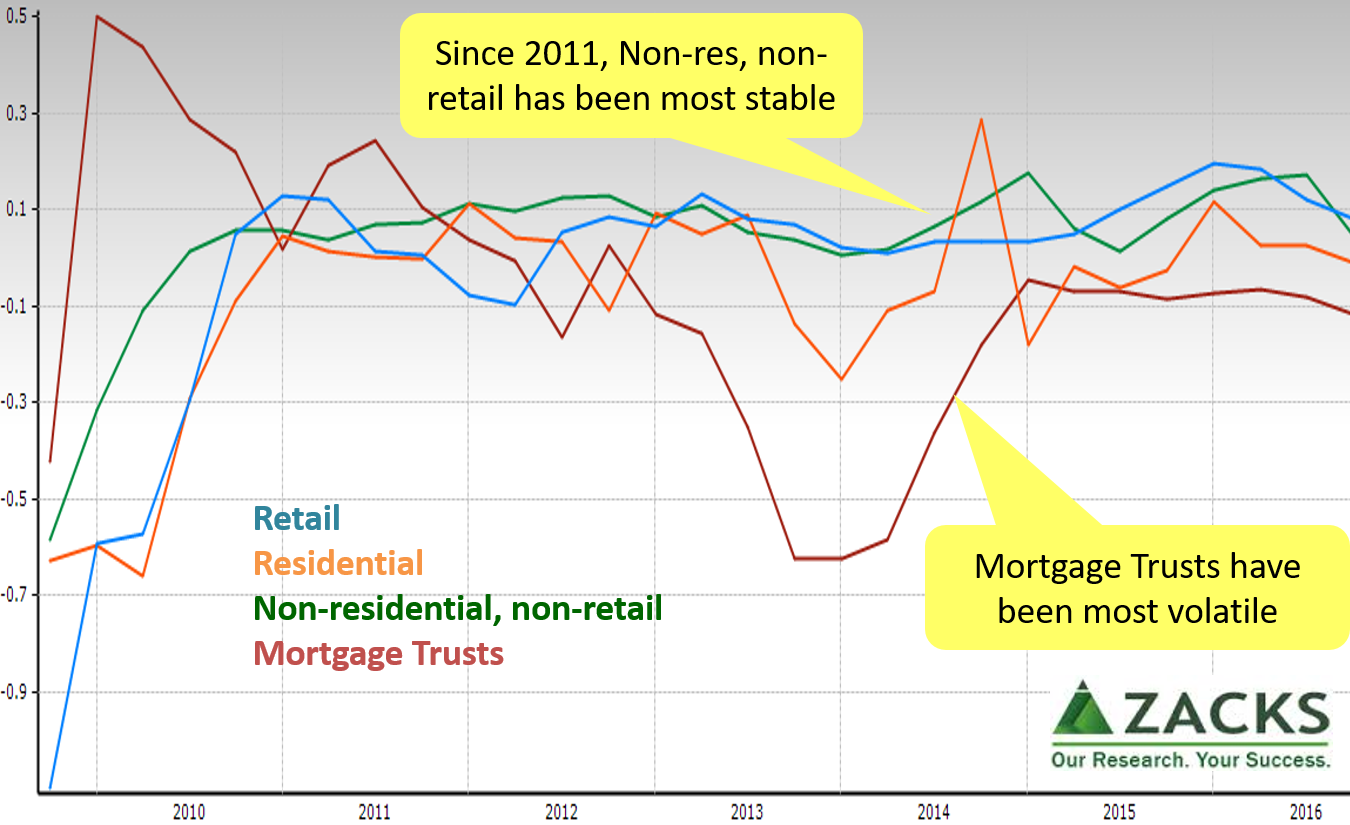 This picture of cents per share change is actually a bit less positive because increases in the general price level eat into DPS and the percentage change decreases as the prior year dividend grows.
Investors face three types of risk, 1) market volatility on price due to the Federal Open Market Committee (FOMC) or broad macro influences, 2) slow leak or popping of the price bubble and 3) operating and financing issues that could impair dividends. Operating includes vacancy rates, rental rates, and payments.
Investors that sought safety in REITs benefit by understanding:
- REIT prices bubbled like other prices bubbled by the FOMC – some far more than others
- REIT prices occasionally had trading bubbles on top of the FOMC bubble because of defensive rotations, without fully falling back
- REIT price volatility isn’t always less than the market. That’s a myth. Why? Because REITs trade more in response to central banks, global funds flows and rotations than “stable” real estate. Investors have opportunity. For example, traders often assume excessive sensitivity to interest rates compared to underlying fundamentals. Good REITs are designed to protect against rising interest rates – check the specifics to benefit from the mistakes of others.
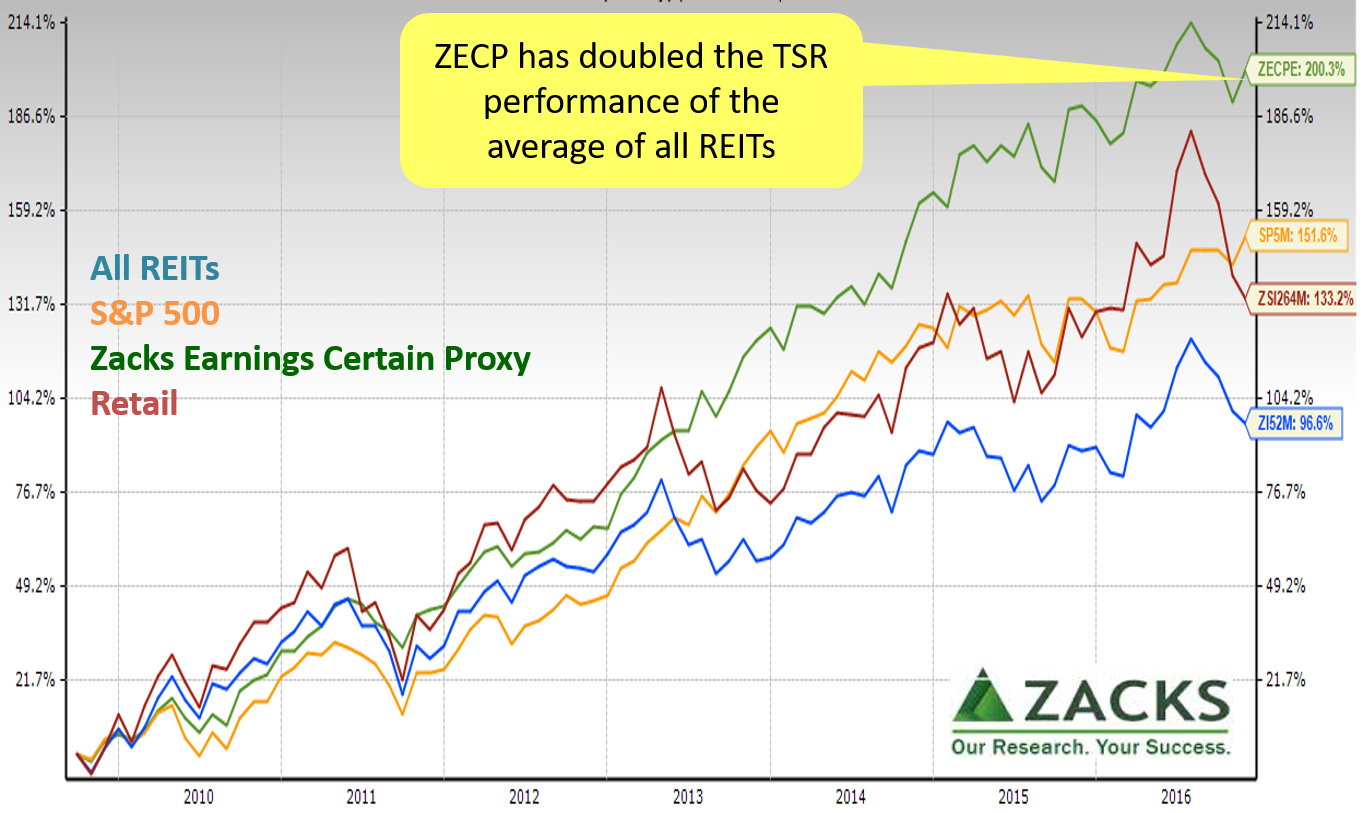
- Other investment categories have performed better on a Total Shareholder Return (TSR, price and dividends) basis. Since September 2009, both the S&P500 and Zack Earnings Certain Proxy have outperformed the top REIT sub-industry (Retail) and the overall REIT industry. Since September 2014, ZECP again was tops with Retail REITs edging out the S&P 500.
 As we frequently caution, averages hide answers. So far, we’ve been using the Zacks sub-industries.
Next step is to drill down to specific REITs. For ZRS users:
- Click “+” sign next to the main ticker window to decompose a sub-industry composite into the individual REITs; these will now be in the white ticker box.
- Click “v” in the ticker box to scroll to a REIT of interest.
- In the menu ribbon, click “Financials” to see the specifics of that REIT or click “Peers” to see it compared.
- Once you have screened by the numbers, you can click “Financials” again to drill all the way down to SEC filings (including interest rate information) and whatever other research you wish to find safer REITs.
Bottom line:
- Caution: REITs do not necessarily reduce bubble or trading volatility risk
- Optimism: Pick carefully, considering REIT types, fundamentals, and macro and trading influences
To learn more about how to apply these insights to your professional portfolio, business or policy initiative, contact “editor” at this URL.