Fed-driven equity bubble, market exuberance, and political uncertainty led many investors to high-dividend stocks. Yet, macro fears from oil & gas to political still generate headlines about danger in dividends. Finding safer dividends isn’t about running from headlines, or chasing tips or even ratios, it’s about screening for dividends that fit your objectives and checking drivers of dividend health.
For the person who views dividends as security, fears are stoked by headlines that name companies with recent dividend cuts. But, that’s not widespread and macro troubles don’t uniquely target high-dividend stocks. Those headlines are a distraction from the daily problem of buying, holding and selling. To make those decisions easier, avoid three common mistakes.
Mistake #1 — failing to understand that isolated dividend measures are a distorted picture of dividend health
- “Dividend” usually means “dividend per share.” It can be calculated with prior, current or forward period. It can be annualized as a single period times four or summing four periods. Caution: buybacks increase dividend per share, even if total dividends paid is less.
- Dividend yield compares dividend to price. Caution: Falling price increases yield. The reasons for the price fall may indicate future problems. Dividend yield is generally quoted on current Your personal yield is based on your acquisition price – that’s the yield that matters when you consider selling and buying something else. Caution: A new investment needs a combination of higher price appreciation, stronger stability, or higher dividend to be a better investment.
- Dividend payout ratio is dividend compared to earnings (with variations for how shares are counted). Caution: Ratio can go up due to falling earnings. Why did earnings fall?
- Dividend changes over time. This can be calculated for any of the above – DPS, yield or payout, most often DPS. It can also be calculated in different ways such as trend line calculated over a past x number of years, two-point change (current compared to x year(s) ago), change compared to a base average (current compared to x year average) and more. Caution: Each method answers a different question. For example, a dividend cut this year is less apparent in a five-year trend line than comparing this year to a five-year
- Dividend stability. This measures how volatile the dividend has been over the past x years. Stocks with consistently growing DPS are preferred to those with sporadic growth or decreases. This is usually calculated as the “R-squared” or coefficient of determination of the trend line calculated over the past x number of years. Caution: A high R-squared just reflects a tight line, whether up or down.
To overcome this mistake, first, know the definitions. Second, know what causes ratios to move – example below.
Mistake #2 — insufficiently checking the drivers of dividends to determine whether past performance is likely to continue.
- If dividends have been driven by financial engineering or cost-cutting that is running out, then caution.
- If dividends have been driven by cash from top line that is threatened by under-investment, patent expiration, or new market problems, then caution.
- If dividends are from investment vehicles based on land, structures, equipment, or rights (e.g., minerals or patents), then caution — as with mortgage-backed securities, determine whether the contract returns on specific assets will persist.
To overcome this mistake:
- Evaluate the global (e.g., econ, liquidity, politics and tech), industry (e.g., oil & gas or industry maturity), and company conditions (e.g., competitive moves, major orders, politics, litigation, and governance).
- Apply these drivers to a business model and follow effects through to financial line items.
- Consider how flows of funds and trading are distorting the relationship between price and fundamentals. For example, how foreign flows seeking safety in U.S. Real Estate Investment Trusts or trader defensive rotations might be bubbling prices. For retail investors, global funds flows can be seen in news stories of political stability and central bank moves. The effects on stocks can be seen in excessively high ratios, such as price to sales and price to free cash flow.
Mistake #3 — confusing aggregate averages with specific investments.
In the past, we’ve pictured five-year dividend growth rates, R-squares, price change and compared dividend-adjusted price growth at “Three pointers to safer dividends.”
We’ve discussed dividends in the context of problems with Price/Earnings ratios in “Five reasons Earnings per Share is over-hyped” and more in our Market Fundamentals section.
To overcome Mistake #3, first, understand how the ratios behave over time. Second, look at company-level data.
To understand ratios over time, let’s start with dividend per share, dividend yield, and dividend payout ratio. We’ll show both the S&P500 and Zack’s Earnings Certain Proxy (ZECP). ZECP is a group of 70-80 companies with historically consistent earnings that excludes cyclical and interest-rate sensitive companies. ZECP has far outperformed the S&P500 as we illustrated in “Step 2: Don’t be fooled by investing “styles” – how to tell spin from substance.”
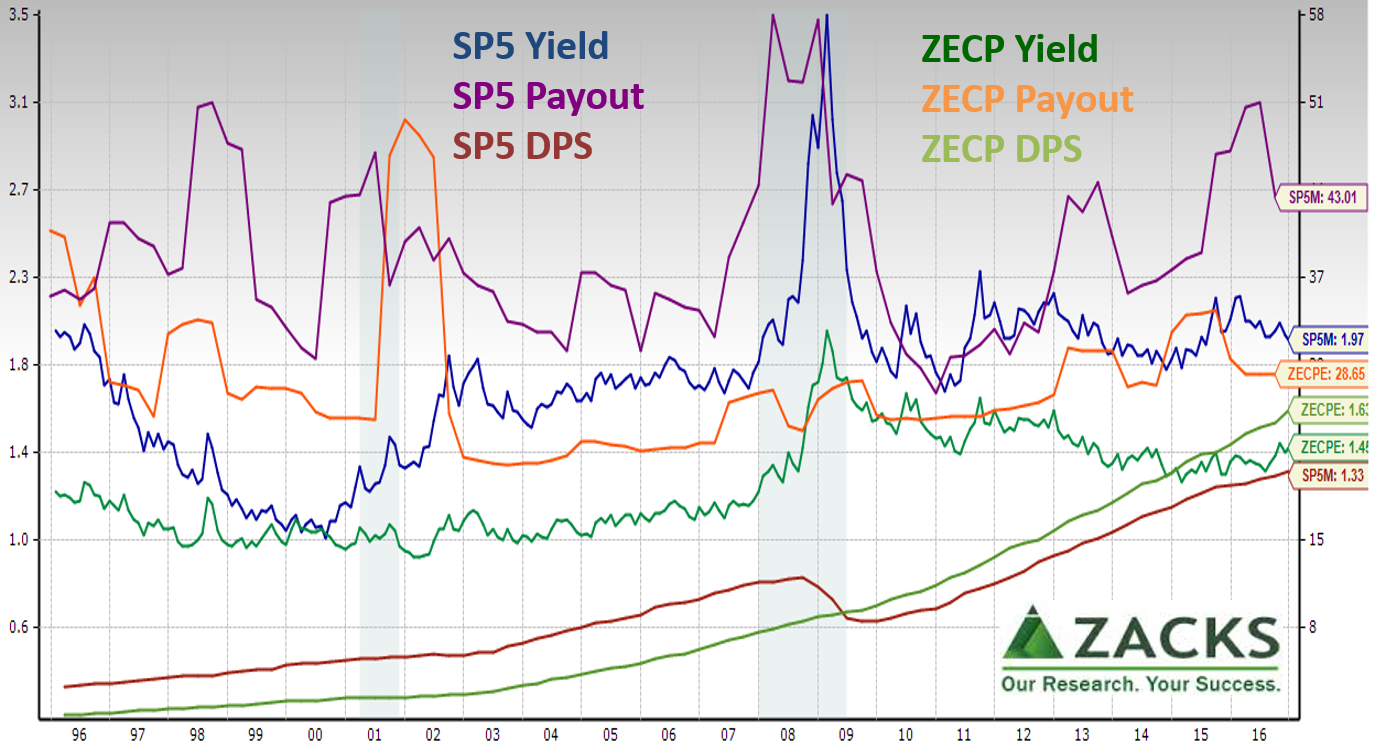 As dividends are paid with varying frequency, DPS is calculated as prior period times four; other versions of DPS are also available in ZRS.
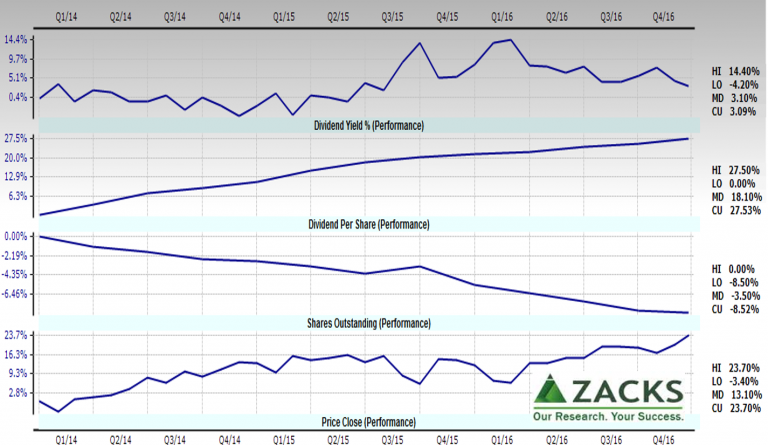
Ratios are just the result of the numbers that feed them. To discover what moves Dividend yield, use Zacks Research System (ZRS) panel chart…
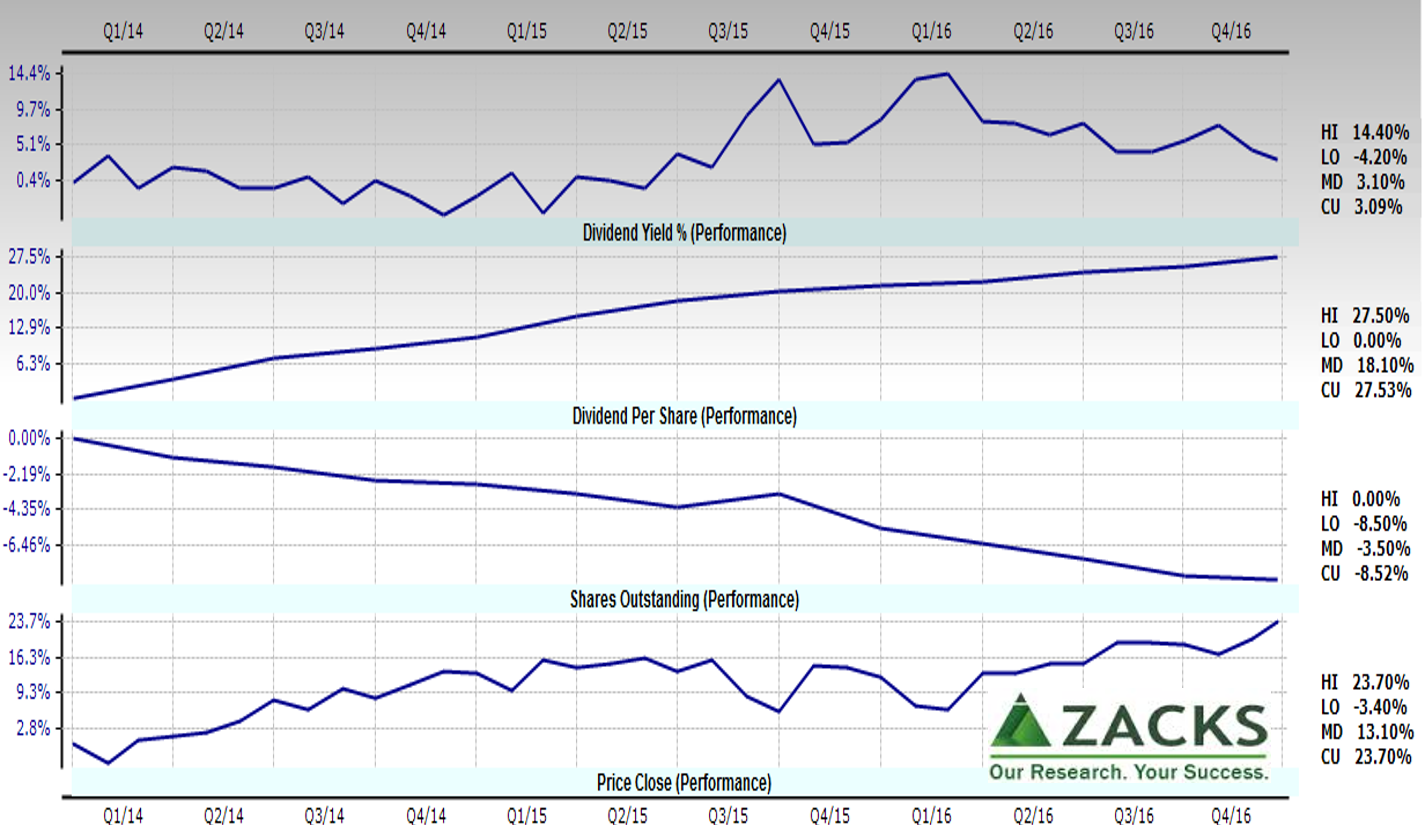 Showing these on a percentage change (performance) basis reveals how much share buybacks have contributed to the increased DPS. Also, DPS increased just slightly more than price as seen in the small increase in dividend yield. Mostly because price is more volatile than DPS, yield also is more affected by price.
Two key points: 1) Ratios and related dividend composite scores can easily mislead because they hide the dynamics that matter and 2) outperforming averages requires a company-level view. An advantage of individual stock-pickers compared to big funds is that individuals can be more selective to significantly outperform. “Smart beta” funds and others are a way to toss out the bad apples from broad indices, but they cannot toss out enough to significantly outperform due to size and diversification requirements.
For company-level information, we use the screener in ZRS. Let’s start with a conventional view that EPS matters because of influence on dividend growth. Adding to the views in “Three pointers to safer dividends,” let’s take a look…
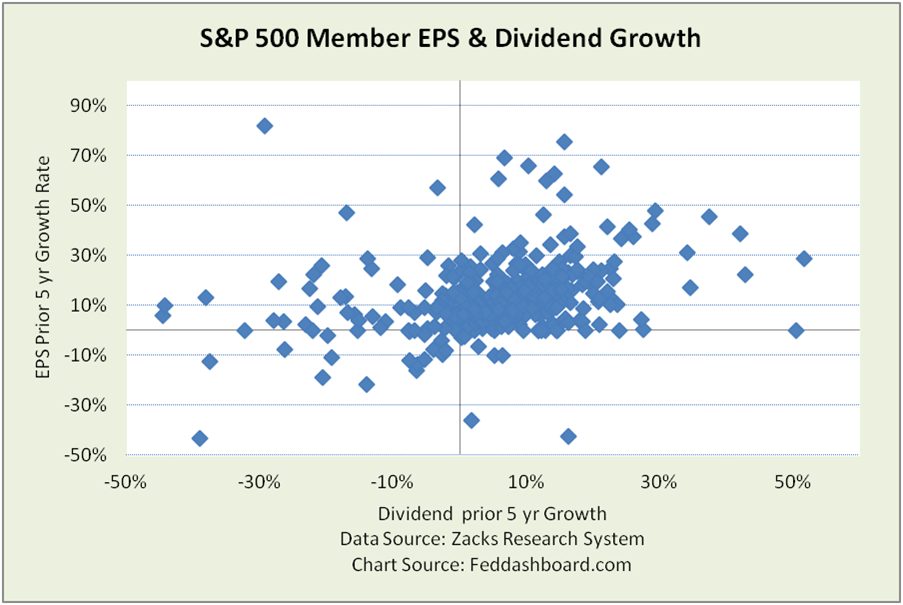 Goodness is to the upper right, where most companies are. BUT, the link between EPS and dividend growth is the payout ratio.
Below, we can separate companies increasing and decreasing payout ratio. Companies sustaining dividend growth with lower payouts are usually enjoying higher earnings.
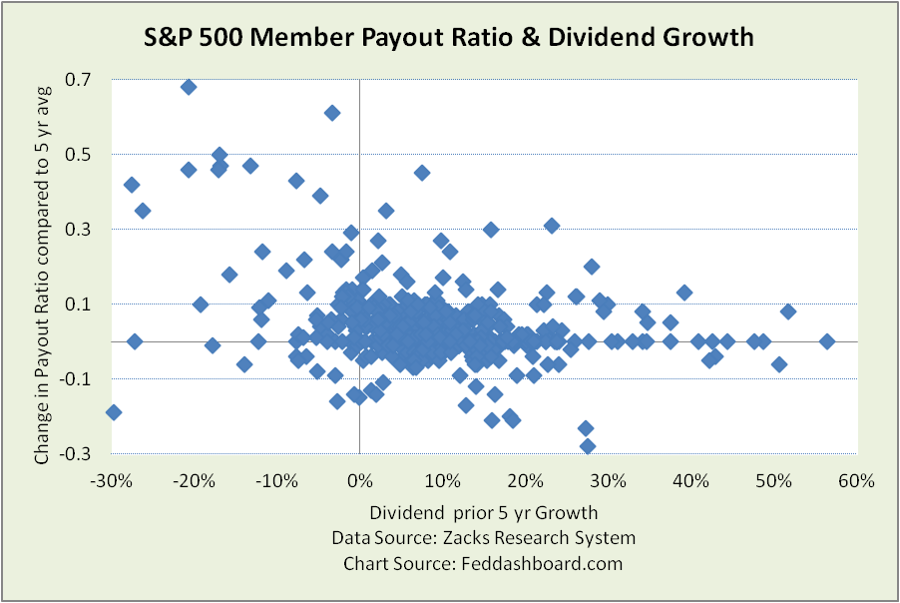 Another plot (not shown) compares change in EPS (current minus five-year average) to the same measure for DPS. This flags companies that increase DPS when EPS falls (increasing payout ratio).
As always, your performance improves from throwing away more bad apples.
The next question is how much earnings growth is driven by sales growth versus cost-cutting or financial engineering. To find the answer, start by looking beyond earnings to free cash flow and sales that drive dividends and price. This is especially important with asset-based investment vehicles. Mechanically, click through the ZRS drill-downs.
If you want to sell, what could you buy instead? Isolated ratios would give a limited view, so three steps help:
- Define your fishing pond based on your desired mix of dividend size, growth, and stability plus price growth and stability. As always, lack of clear objectives leads to muddled portfolios.
- These preferences are expressed as factors to load into the ZRS screener. The result is your ticker list.
- Depending on your passion for research, from there you can do all the qualitative evaluation and back-testing you wish.
Clearly knowing what you could buy makes the hold-sell decision easier.
In summary:
- In deciding whether to buy, sell or hold, most investors stumble over three common mistakes
- You can overcome those mistakes by using multiple measures to avoid distortions, probing dividend drivers, and digging below aggregate averages
- This makes it easier to reveal what is hidden and pick better dividend stocks
To learn more about how to apply these insights to your professional portfolio, business or policy initiative, contact “editor” at this URL.
Data Geek Notes:
- Zacks SP5M uses the “apples to apples” view for consistent historical comparison
- Change in payout ratio used in scatter plot is current minus five-year average
- For the scatter plot, extract the data via ZRS Screener; for charts, axes were trimmed

