
The falling ratio of margin debt to corporate equity seems to be good news. At least it means less leverage and might mean the equity bubble is being taken more seriously. It also seems another sign of the Fed’s footprint in the market – warning investors and (hopefully) the Fed.
Securities margin debt at broker-dealers has been falling since 3Q2014. This was the same the time speculation grew about interest rate increases from the Federal Open Market Committee (FOMC).
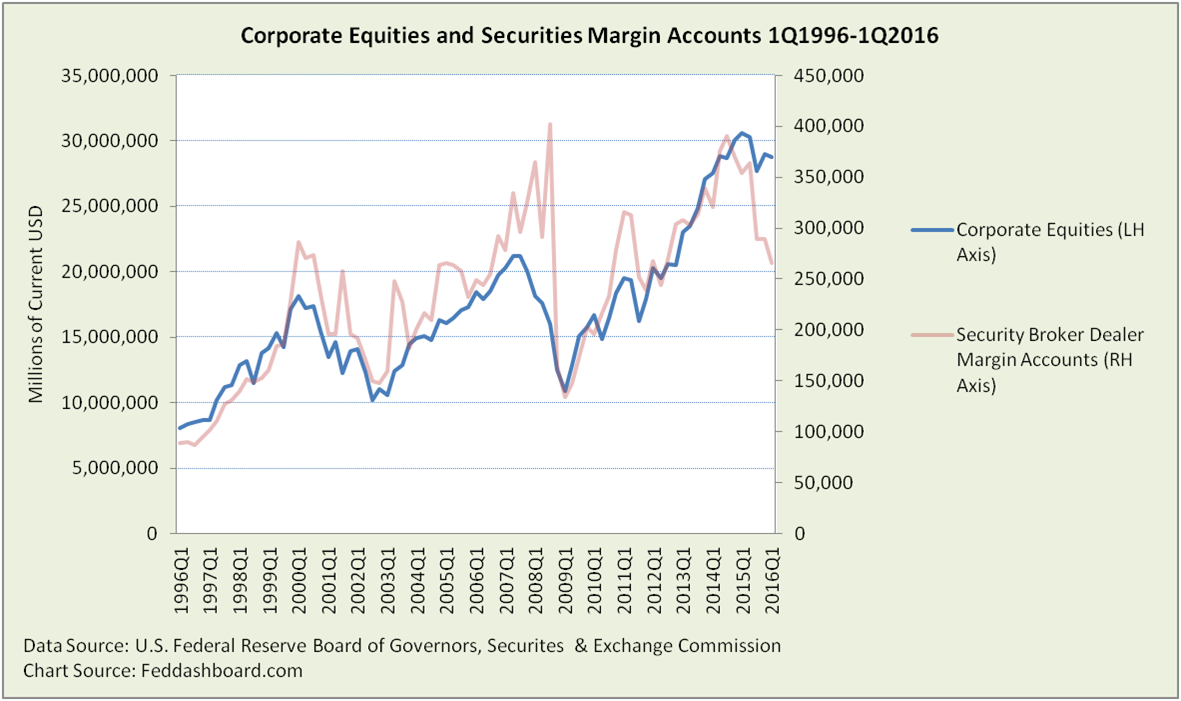 Nominal margin debt being down to the levels of the tech bubble is welcome. Yet, this pattern of falling margin accounts has been unusual as: 1) the proportion was greater than typical and 2) it fell from a point relative to equities that is entirely new in our “triple bubble” (tech, mortgage and Fed) world of the past two decades.
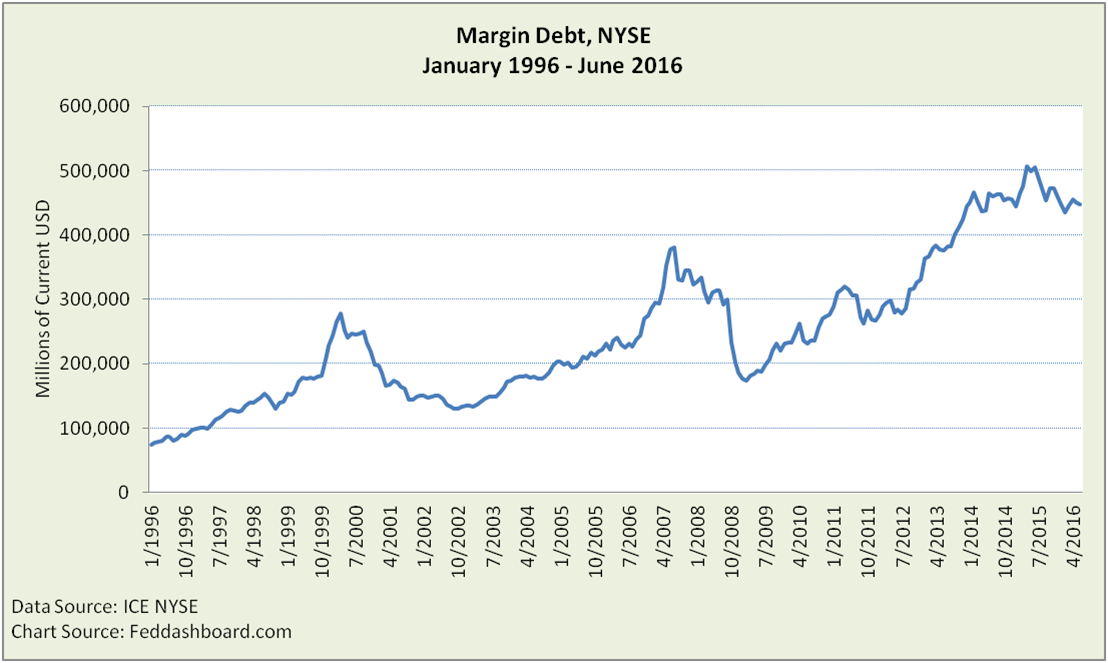
The NYSE margin debt measure is significantly different. This might be a reflection of trading style and company types at the NYSE, such as far fewer tech companies in 1999. NYSE margin debt has been more sideways since February 2014, with a bit of exuberance in 2Q2015 and slight downtrend. Looking farther back, the swings have been less dramatic and it was less affected by the tech bubble.
 Patterns to inform action are more easily seen if we 1) go back to the broader market view of the first chart, 2) show the two time series as a ratio and 3) look back to 1Q1945 and days before the triple bubble.
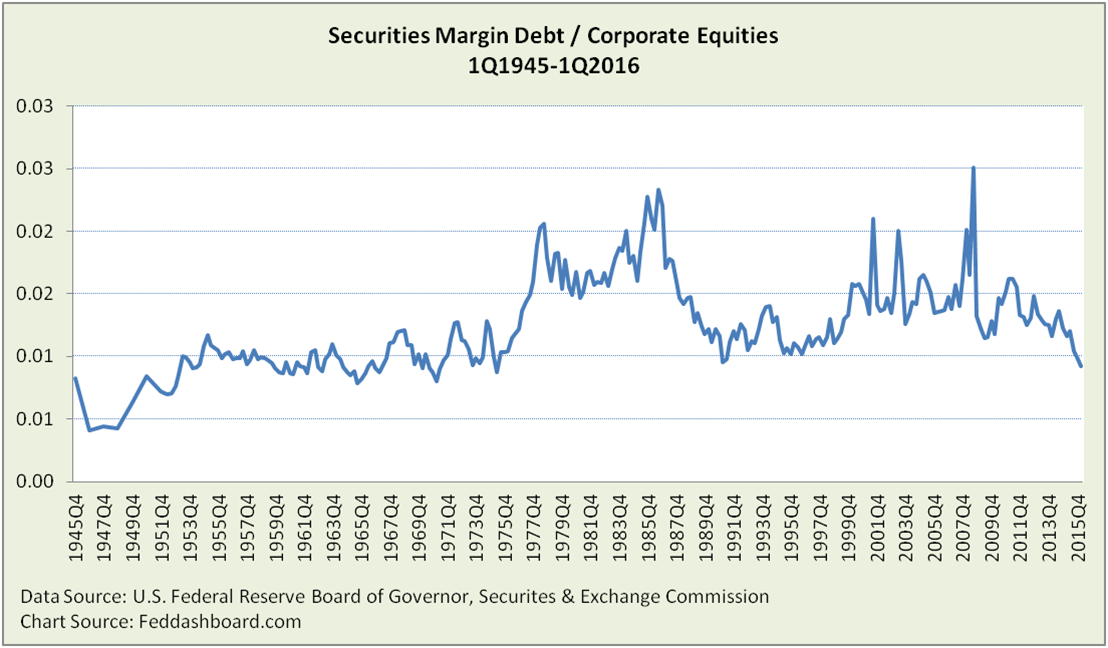 Here, the ratio has been on a clear downtrend since 3Q2008. Interestingly, it took “the market” a full 6 quarters to “get” the implication of the adjustable-rate mortgage trigger in 1Q2007 – thus it pays to look for more fundamental triggers than margin debt. The more recent downtrend starts 2Q2011.
Care is needed in interpretation because of other trends such as the FOMC-driven equity bubble, regulatory and a smaller proportion of today’s investors – including those in mutual funds – trading on margin.
The equity bubble can be measured by the Strain Gauge ratio of the public equity markets to business production as we’ve pictured in the past. It reflects how far equity market prices strain above the tangible goods and services market. Just as the valuation of a retail store can be excessive for a given level of sales, this strain gauge values our economy.
Investor insight
- Margin debt measures differ — investors should watch both the Fed/SEC and NYSE measures
- Good news is that the margin/equity ratio is returning to the more sane levels of yesteryear
- Good news is that this might reflect caution about the magnitude of the FOMC’s bubble; at least it reflects trader fear of FOMC decisions.
- Bad news is precisely that fear of the Fed and the Fed’s different footprints in the market. This has entirely changed the central bank-markets relationship. The FOMC isn’t a traffic cop outside the concert call or even the electric utility lighting the hall. Instead the FOMC has become the permanent guest conductor of a never-ending symphony.
Bad news is the FOMC still hasn’t recognized the magnitude of the bubble. What seems to be the most helpful next step by the FOMC is implementing a “cap and lift” policy that explicitly recognizes that the natural interest rate has fallen. Prior policies have “stirred the silt” making the natural rate difficult to see. To navigate muddy waters, the FOMC could announce consistent and modest rate lifts of 1/8th per month toward 1%. Then pause to explore the location of the natural rate. State that the next policy rate would likely be closer to 1% than 2% — far from 3.5% — to put a cap on expectations and market volatility. To further reduce volatility, communicate that the natural rate is reflective of more enduring data, rather than the high-frequency economics that have contributed to market churn.