
From Yahoo! Finance… Stocks appear to be slogging their way to new highs over the past year. Yet underneath the surface, it seems there’s been a good, old-fashioned rotation into more defensive stocks. Here’s how investors could play it.
 How to play smarter defense in a defensive market
For inquiring minds, more insight…
Mark Newton and Brian Barnier previously explained in “Defensive rotation defies broader measures” how neither broader technicals nor fundamentals supported the defensive rotation that took hold in January.
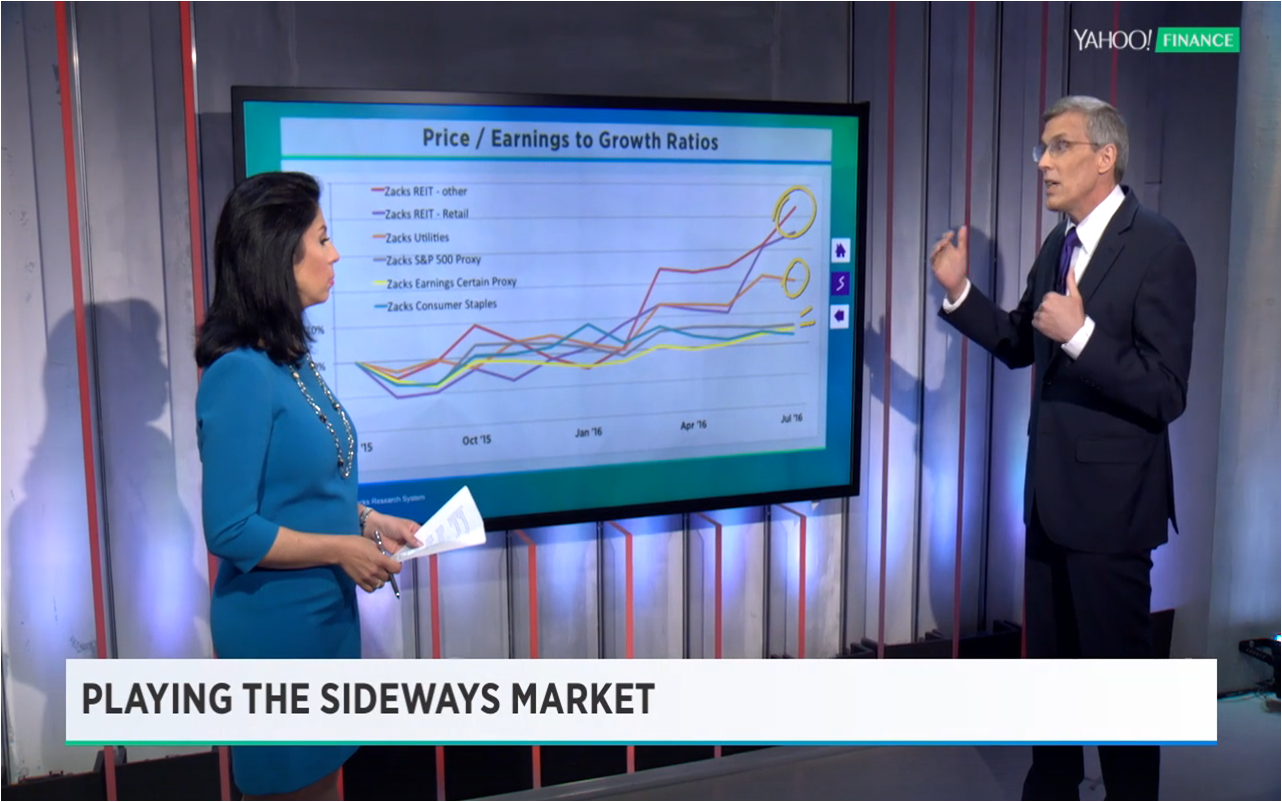
In today’s Yahoo! Finance video, there are two exit doors available to investors concerned about the current market:
- One door is to evaluate your risk differently. STOP looking at all risk like trading risk with standard deviation, Sharpe Ratio, VAR or whatever. START looking at the big bubbles and rotations as risk. ASK yourself what is or is not captured in math of simple ratios like P/E or PEG. On one hand, do those ratios mask extra value because dividends or growth are usually high? On the other hand, is it artificially lower because of share repurchases? The scatter plot groupings in the video reflect opportunities and cautions. PROTECT yourself, if there isn’t fundamental support, set your exit trigger based on a price level or momentum. This is where our technical friend, Mark Newton, can help.
- The other door is to STOP struggling with the short term and switch to more stable or business-model based strategies. For example, Zacks Earnings Certain Proxy is a benchmark designed for stability that has outperformed defensives and S&P500. If an investor is NOT fired-up to play “tops and bottoms” with rotations, then these are great risk-adjusted returns. More on business model-based investing in our occasional series on better stock picking; see the Market Fundamentals section.
At FDF, we’ve repeatedly cautioned about the dangers of using P/E ratios and their many flavors (forward, backward and expected growth-adjusted PEG). Why? Because the “P” has been distorted by the Federal Open Market Committee’s asset bubble, the “E” distorted by earnings engineering and it assumes a static world where “P” and “E” are relatively stable to other fundamentals. For more, see:
- Avoid being misled by quarterly results, ask five questions
- Five reasons Earnings per Share is over-hyped
- Three errors to avoid in examining earnings
- To find better measures of value, look beyond broadsheet relics
For forward ratio versions, complications with analyst estimates were examined at “Saw tooth effect” and analyst insider secrets
The scatter plot is a visual, powerful and fast way to spot distortions to which the P/E and variants are mathematically vulnerable. To see, plot your favorite flavor of P/E on one axis and an input to the equation on the other. In the accompanying video, change in shares outstanding was the input plotted. Dots below zero on the vertical axis represent a company with a P/E ratio that has been lowered by share repurchases making it look like more of a value than it would be otherwise. In theory, this shouldn’t matter because the cash used to reduce shares also reduces the value of the company and thus the “P.” BUT, theory doesn’t account for the market imperfections that leave the P adjustment lagging. Be warned.
For Zacks Research System users: How to display the Zacks Earnings Certain Proxy member companies:
- From the navigation ribbon across the top of ZRS, click “Research” icon
- Then a tree menu will appear, first pick “Equity Research” then “Zacks Model Portfolio” and then “Zacks Earnings Certain Proxy”
- Then a screen will pop up with each of the 75 companies, current summary statistics, Zacks ratings, and links to .pdf and .doc files with more detail on each company.