
Risk to investors has been creeping up through two trends – the rise of autonomous financial markets and rise in commercial & industrial lending. Use the right metrics to more easily watch these risks.
Let’s make this practical… What is the basis of a loan to a little retail shop? A lender looks to assets (fixtures, equipment or inventory) or flows (production, sales or income). Credit analysis expects consistent ratios such as loan-to-value, debt/assets or loan payments/income. Economy-wide, we’d also expect to see some consistency, subject to tangible changes such as mix of industries (and asset-intensity) and growth rates of companies.
Do we see consistency in the data? No.
Debt ratios have grown over the decades. To more easily compare over time, lending is shown relative to production as measured by Gross Domestic Product (GDP). In this view, loans and repurchase agreements are on a long upswing with corporate bonds ramping up in the 1980s as the bond market went from sleepy to psyched-up. As mortgage securities were so prominent in the housing credit bubble, Government Sponsored Enterprises (Freddie and Fannie) are shown for comparison.
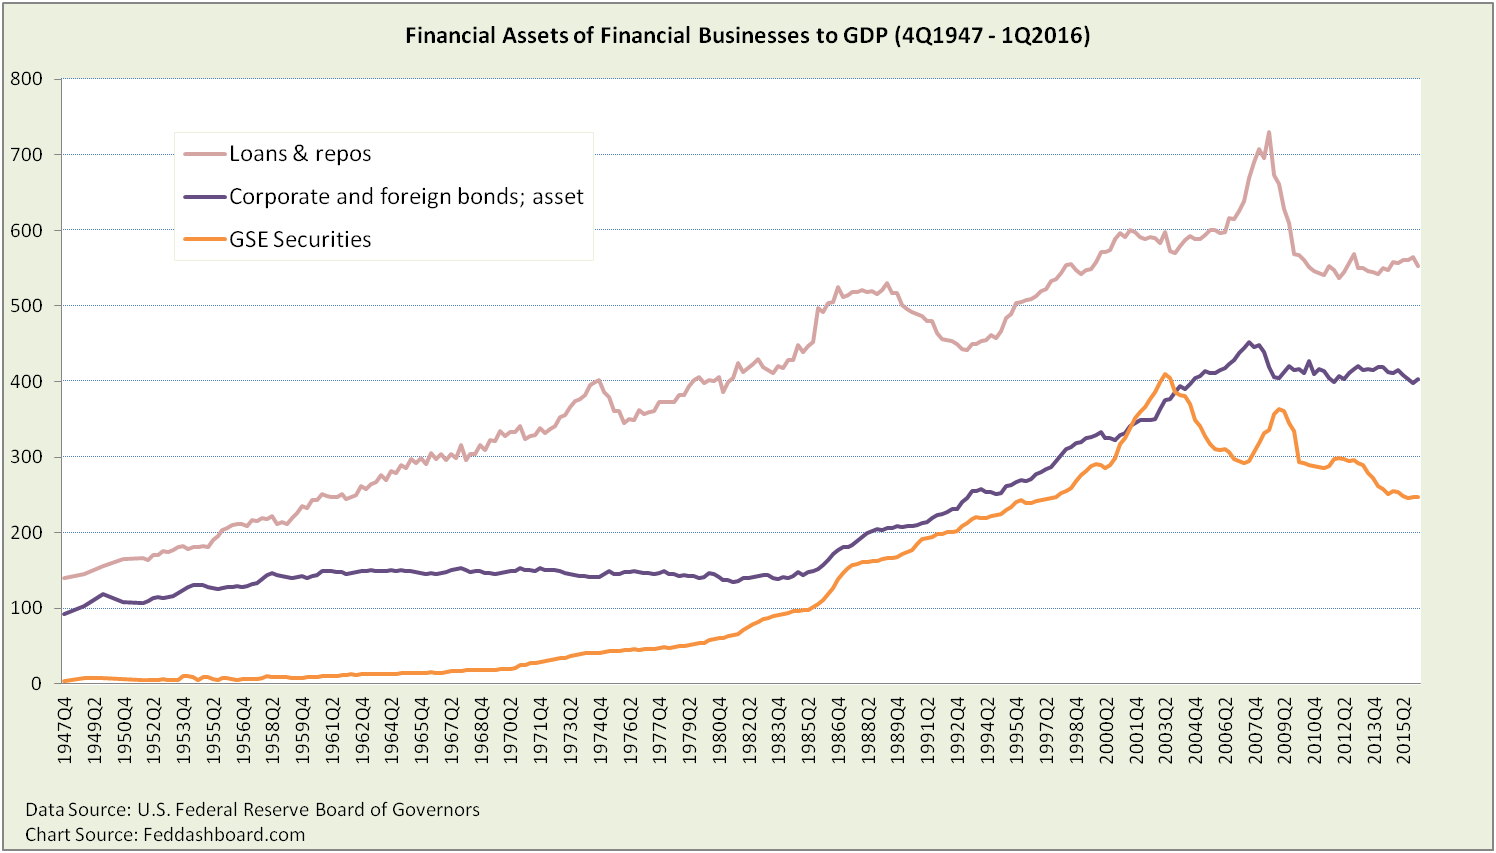 The corporate bond story is the risk of increasingly complex instruments of the past three decades — new automation, new rules, new contracts, and new distribution. Bonds went from trading in dusty drawers in the “Garage” of the New York Stock Exchange to being “the” hot and exciting departments of broker-dealers and big banks. This was the rise of autonomous financial markets.
Good news, bond to GDP levels have been roughly sideways post credit crash. Bad news, that level is 2.6x the 1947-1984 level.
“Loans and repurchase agreements” have grown for a longer period of time and are larger. What are the movers and shakers of this monster category?
Switching to a nominal dollar view for raw comparisons, seven categories stand out.
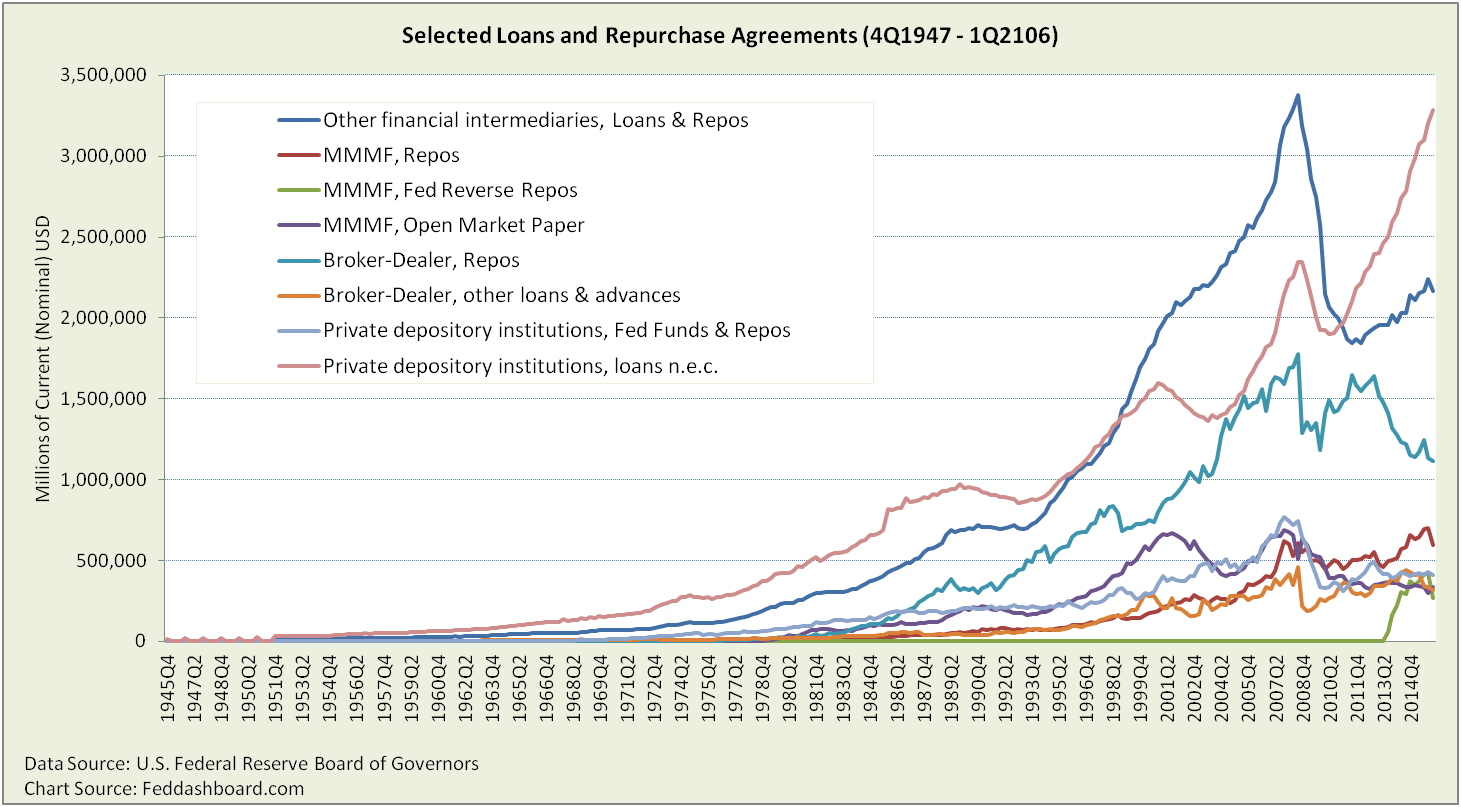 “Other financial intermediaries” are finance companies, asset-based securities issuers and Government Sponsored Enterprises. “Private depository institutions” are banks and credit unions. “Loans not elsewhere classified” are commercial and industrial (C&I) loans, securitized loans, lease-financing and agricultural loans.
As some loans are based on production cycle and some on assets, C&I loans are shown relative to each.
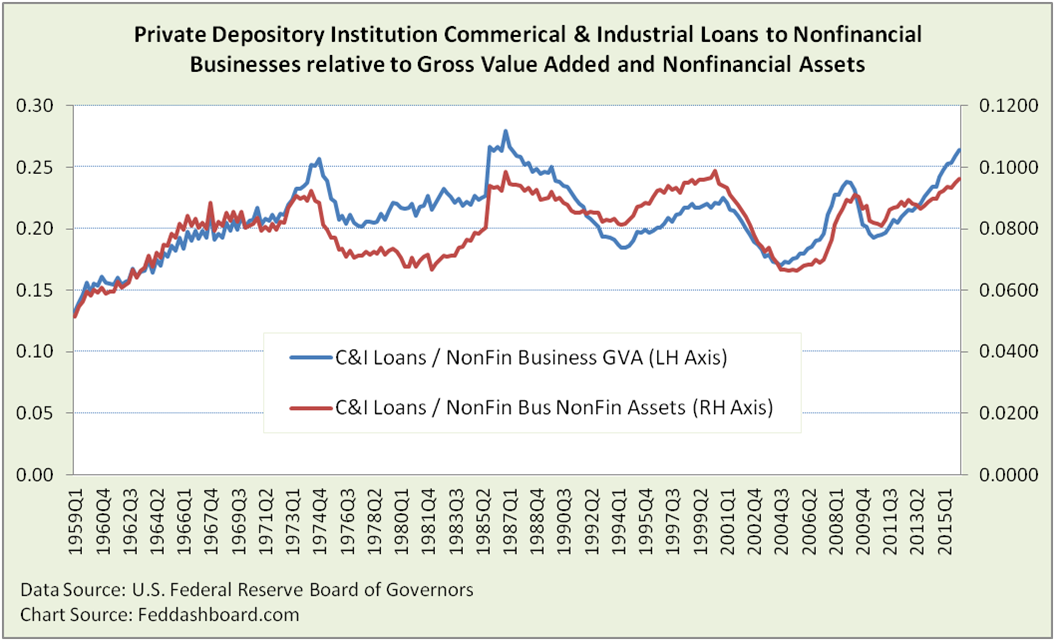 Striking is that C&I loans relative to production (Business GVA, aka Business GDP) are near historic highs.
On a BGVA basis, lending is at its second highest point in history, far higher than at the tech or mortgage bubble peaks. On an asset basis, it is higher than the top of the mortgage bubble.
Good news: For companies seeking loans, contrary to headlines, C&I lending is strong in aggregate, despite many companies struggling for credit.
Caution: Are loan-to-value ratios too high? Including bonds, are debt/equity ratios too high?
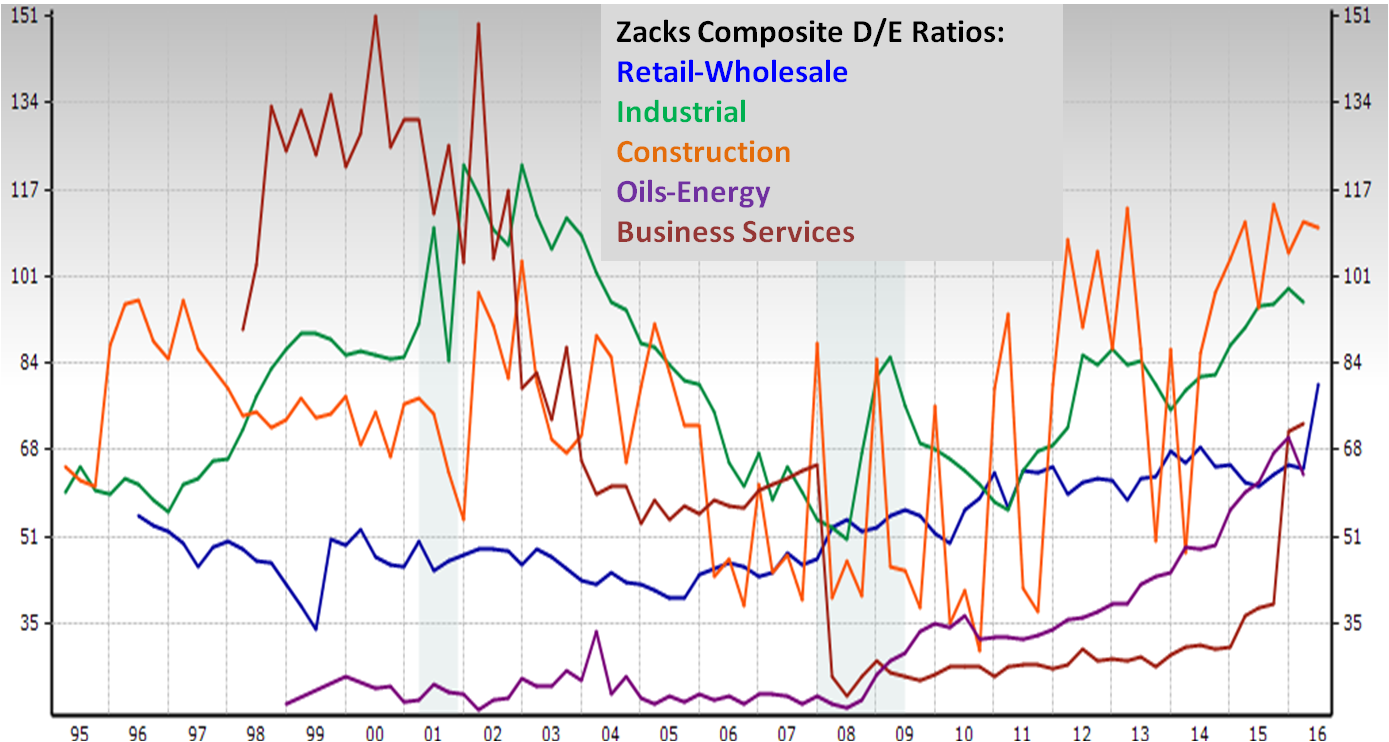
Debt/equity ratios must be considered in view of recent capital structure shifts. Lower cost of capital and higher earnings per share are sought by companies such as Quanta Services, Motorola Solutions, American Airlines, Corning, H&R Block, Express Scripts and Harley-Davidson with large share repurchases and issuance of debt. Today total debt/total equity ratios have been growing post-credit crash, with wide differences by industry.
Debt/equity ratios are also at historic highs other than around when the credit bubble burst.
 For more on debt/equity ratios and company-level differences see “How to separate company financing games from value creation.”
Investor insight:
- Investors and traders should be alert to the market risk of this overall debt level – as we wrote regarding business cycles, deleveraging was aborted.
- Fundamental investors should be alert to credit risk in companies. This includes checking debt/equity ratios and loan capacity, especially when comparing peer companies, and using capital structure-neutral measures of valuation.
Data Geek Notes:
- Data are for financial business, do not include 1) monetary authority or 2) household and nonprofit sector (including pensions and endowments) or financial firms classified as their intermediaries (e.g., hedge funds).
- Business Gross Value Added (GVA) is roughly business sales minus inventory. It is another name for Business Sector GDP.
- Repos, or Security repurchase agreements, are shown gross, transactions between depository institutions are not netted out.
- “Loans and repurchase agreements” is series FLxx4041005 that is labeled “Short term” in the Financial Accounts tables. However, loans of all maturities actually sum into that time series.