
Investors seeking companies with strong value creation must first peel off the veneer of balance sheet engineering. To do this, investors need the right data and analytical “lens.”
In a sideways market, the “go to” approach for higher returns is smarter stock picking. Yet, success requires: 1) Sufficiently easy access to detailed data and 2) Right method or “lens” through which to view the data. Without these an investor is structurally blind.
In today’s economy, share buy-backs and heavy use of low-cost debt are common. These can be good or bad. Regardless, investors need to peel off this financing veneer to understand the health of a company’s business model.
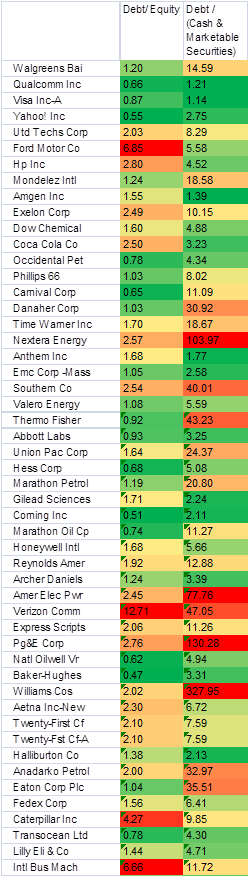
To illustrate, consider debt ratios. Previously, we showed a “flag chart” of debt/equity ratios. Now, let’s compare the debt / equity ratio to the debt / (cash + marketable securities) ratio. This is interesting because of the use of debt to buy-back shares to increase share price and magically improve return on equity ratios, or cash-rich companies locking in near zero cost financing (or not).
Deeper data reveals debt dynamics
The table below is sorted by Shareholder Equity, skipping the top twenty companies to show the next fifty*. The more red is the cell color, the higher is the debt ratio.
Differences are striking. What matters is the reason. Are differences due to balance sheet engineering or business models?
- If balance sheet desperation, is a company sending up a flare for balance sheet activist investors to come hunting? If so, does this create an opportunity to buy in anticipation of a battle?
- If business model, what type? Some are about mixing financial with nonfinancial businesses (e.g., GE or Ford with financial companies). Some are about industries, such as upstream energy versus software development. Some are about value chain management and outsourcing choices (e.g., Apple or Nike). Some are more subtle about competitive strategies to grow value.
The point is that asking “Why?” quickly points to the value of business model-based investing.
Data source: Zacks Research System, Chart Source: Feddashboard.com
To discover the differences, investors need sufficiently easy access to detailed data. This table took about three minutes to define and extract data and another few minutes to sort and color code.
Once data is available, investors can launch insightful investigations into other ratios and time-series comparisons. Yet, a problem is that investigations can quickly lead to endless rabbit trails and dead ends. To overcome this problem, a helpful analytical lens is needed that provides a path for “breaking it down” and finding causes, and overcoming structural blindness. This is the point of business model-based investing.
Data Geek Notes:
- Data are from 4Q2015
- The fifty companies shown are helpful because they avoid ratios swung by mega Shareholder Equity companies and dip into a group that, in today’s market structure, has notably lower trading volume.
- Extracted with Zacks Research System screening tool, using DBDQ database and filtering first on S&P 500 members
- Debt is Total Liabilities, Equity is Shareholder Equity
- Cell color code rules have red at 90th percentile, yellow at median and green at 10th percentile