
6 February 2015
Housing is not a headwind to economic growth; rather it is an updraft with potential to destabilize.
How hot is housing? Before digging into dirt, dig into data (July 2014) pictured how housing investment and prices are still at historical highs, other than the big bubble. Housing is a story about micro-markets; housing type differences were highlighted in Two Tales of Housing (August 2014).
Too often pundits complain that “housing is a headwind” to economic growth and it is ready to rebound. What’s in the data?
Money
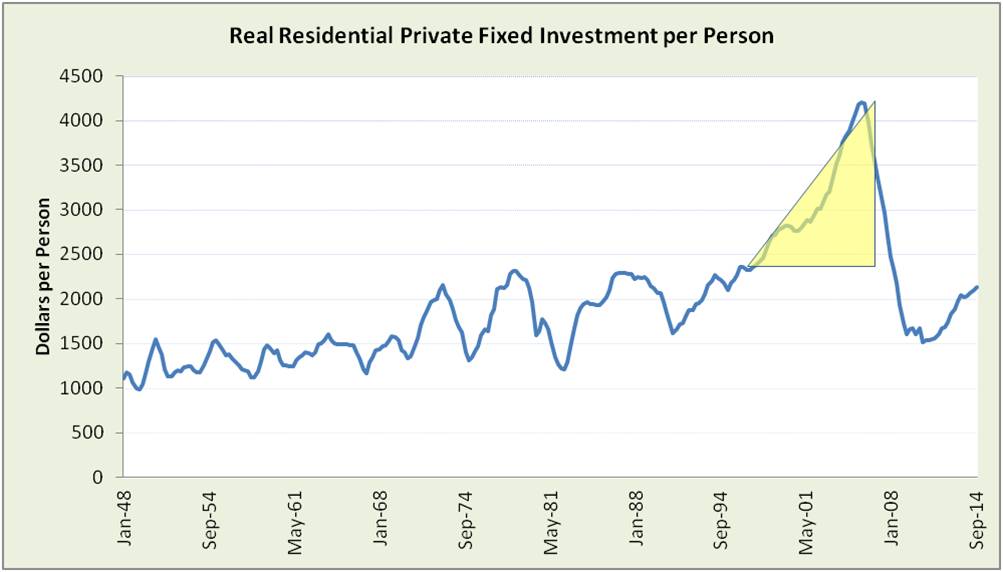
Housing appears in GDP in Residential Private Fixed Investment. Today, investment pushes closer to historic highs.
A glance at history reveals three phases of housing described previously in How hot is housing? Before digging into dirt, dig into data (July 2014).
The Treacherous Triangle marks the dangerous waters of the credit/housing bubble.
 House size
As investment grew in each phase, housing was not just sheltering a growing population, but getting more luxurious and larger.
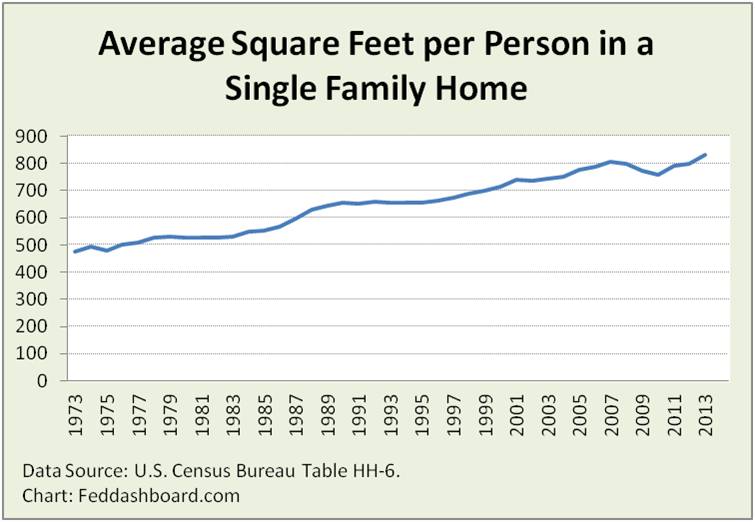 Differences in square feet in 1 unit housing structures compared to 2+ units were described in Two Tales of Housing (August 2014). Post-bubble, while 1 units generally increased, 2+ unit housing structures dipped before trending up again. In micro-markets, the size change has been accommodating fewer people per household, aging population and affordability.
Housing units
Comparing total housing units to numbers of households or population is often said to indicate pent-up demand for housing units – regardless of spending and credit limitations. The ratio has been on a downtrend since the bubble burst. However, this ratio must be used with caution for several reasons.
- The discontinuity in 2000 is due to 2000 Census improvements made to the between-census estimates for 1991-1999. Thus, the 1990 data point could be viewed as roughly connecting to the 2000 data point.
- For household ratio denominators, the discontinuity in 2001 is due to a change in methods that increased number of households, thus reducing the ratio.
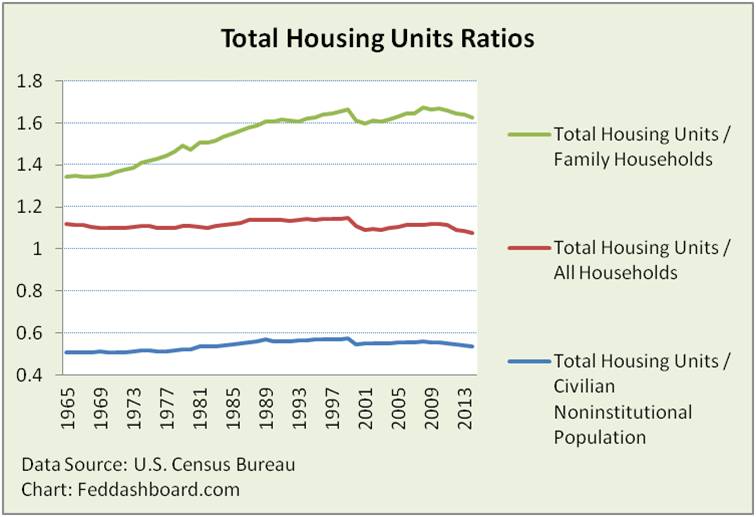 Of the three versions of the ratio, only Total Housing Units / All Households is below historical trends. Given that Total Housing Units / Civilian Noninstitutional Population is at 1984 levels (on a post-WWII climb to a peak in 1989) and that square feet per person is at an all-time high, it is possible that that the All Households version is more of a reflection of societal trend preference. This preference could change if either larger housing units become home to more multi-generation families or roommates, or it is constrained by house price and debt to finance that price. Of course, many of first-time buyers are burdened with historically unprecedented levels of student debt.
Affordability
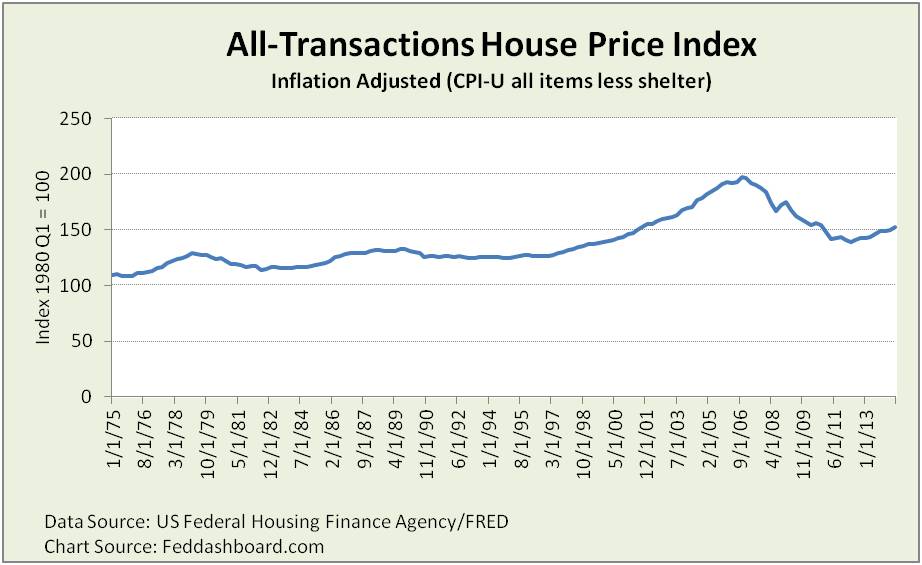
The good news of Federal Open Market Committee (FOMC) policy to drive up housing prices is that it provides a “wealth effect” for homeowners, real cash for home sellers (especially liked by retirees and others facing low interest rates on savings) and inflation to help achieve the FOMC’s 2% target.
The bad news is higher prices for buyers. Instead of falling toward historical levels, the price index is climbing. Today, the index is at 2001 levels, far above what the Reagan Administration considered a problem in the early 1980s.
 The need for affordability helps explain why construction of 5+ unit housing structures is at a high equaling 1989 as described in Two Tales of Housing (August 2014) and rentals vacancy rates are dropping. Since 2004 – before the bubble burst – owner occupied housing units have decreased by over 6% and renter occupied housing units have increased by nearly 15%.
Investor Insight
The gathering storm pits government policy for affordability against government policy for wealth effect, investment, GDP, inflation, real estate jobs and bank credit quality regulation. Until price increases move down toward historical levels, policy options for affordability are largely limited to subsidies and making debt easier (such as lower credit requirements with more credit losses, or lower monthly payments). Managing these conflicting policy objectives and distortions is at least tricky if not destabilizing.
This is why housing is not a headwind. It is also not a tailwind taking housing faster forward at stable price levels as prior to 1996. It is more like an updraft with the potential for turbulence going up and, maybe worse, coming down.