17 February 2015
The ECB’s purchases of large amounts of bonds is like trying to pile up more wood than anyone else in the Minecraft video game (acquired by Microsoft for USD2.5B) – it has little affect on other gamers with a “world” of resources and endless creativity.
In the real world, the ECB can’t inflate low prices when those prices are the result of global supply and local digital age shopping.
Central bank actions to fight low prices are intended to bubble stock and bond prices to create a “wealth effect” to increase demand to inflate prices to create a fear-driven need to buy before prices rise to further increase demand. This theory has run into today’s reality.
First, 4Cs of consumer demand. For example, consider Catherine, a Parisian shopper:
- Capacity in wages and salaries after debt and tax payments
- Confidence seems to matter more today than central banks. Evidence includes insight from political polling, such as distrust of government that may well include distrust of stimulus initiatives (beyond the popular view of making rich shareholders richer).
- Composition changes in her product type preferences, and behaviors such as the rise of the “sharing economy.”
- Clarity in price discovery — consider a woman from Turkey using the Uber taxi service at an economics conference in Boston.
Second, Catherine is today buying in a less supply-constrained world of the PIPE factors:
- Pacts for trade
- Intellectual and physical capacity for trade
- Peace-building leading to rule of law leading to more country self-sufficiency and then trade
- Exponential technology not just for cost-cutting, but product innovation and accelerating trade
Also, central bank policy depends on making Catherine expect 2% inflation. Yet, daily reality is that Catherine sees wide price variations — falling in electronics, fluctuating in food and exploding in alcoholic beverages. In the U.S., a person under the age of 45 has never shopped at a time when prices (excluding food and energy) mostly moved together.
Euro area view
Expanding on Decoding Eurozone Deflation, February 2015, Euro area trade data adds to the picture as in the U.S. analysis, World to U.S., “Do you get globalization yet?”, December 2014.
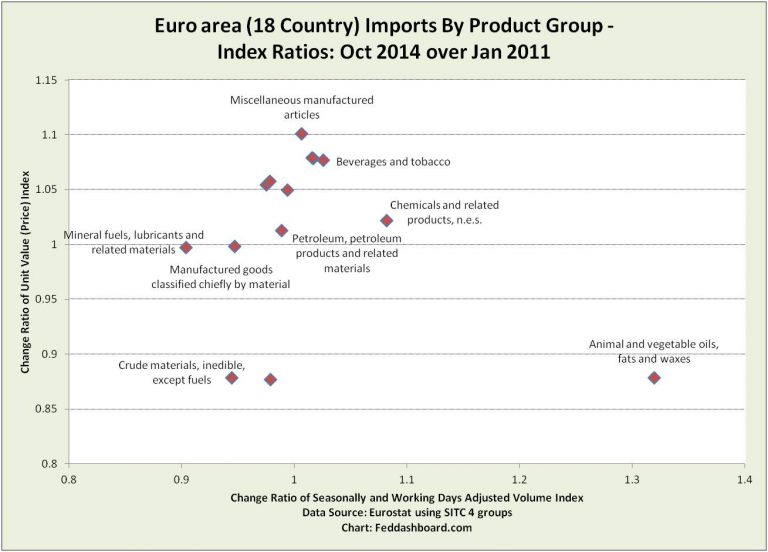
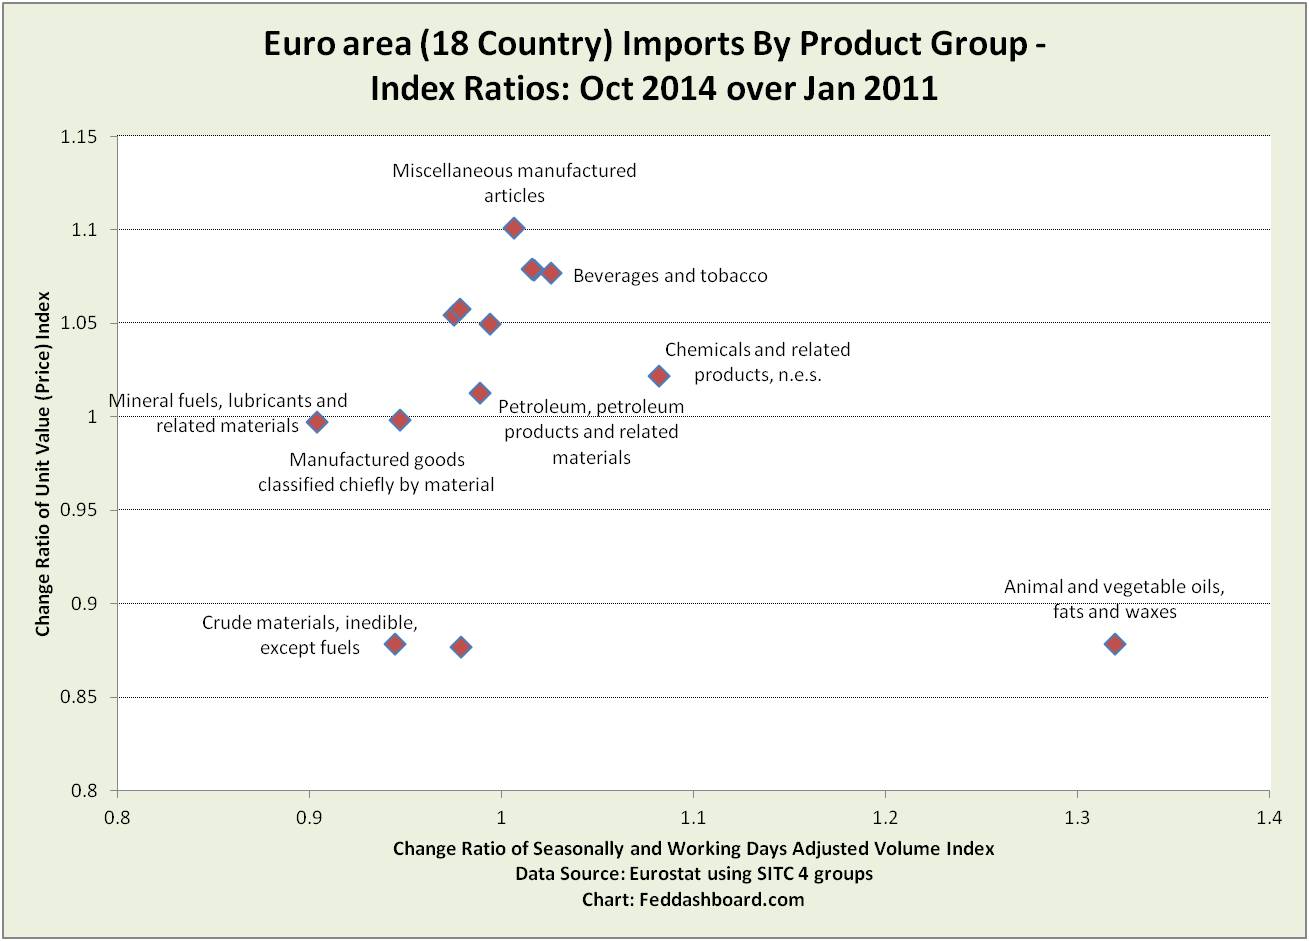
As “deflationary” fears trace back to mid 2011, consider a scatter plot of change in price to change in quantity. Even in broad super-groups and groups of products, the bogyman of deflation disappears as detail comes into view:
- Global commodity prices pull down average prices.
- Chemical prices have been increasing for the past few months and include the influence of ethanol.
- Food, beverage and tobacco post strong gains.
- “Miscellaneous manufactured articles,” includes housing components, furniture, clothing, jewelry and art.
Clearly individual product stories are playing out, including demand drops. Thus, the data challenge the notion of a generalized monetary deflation.
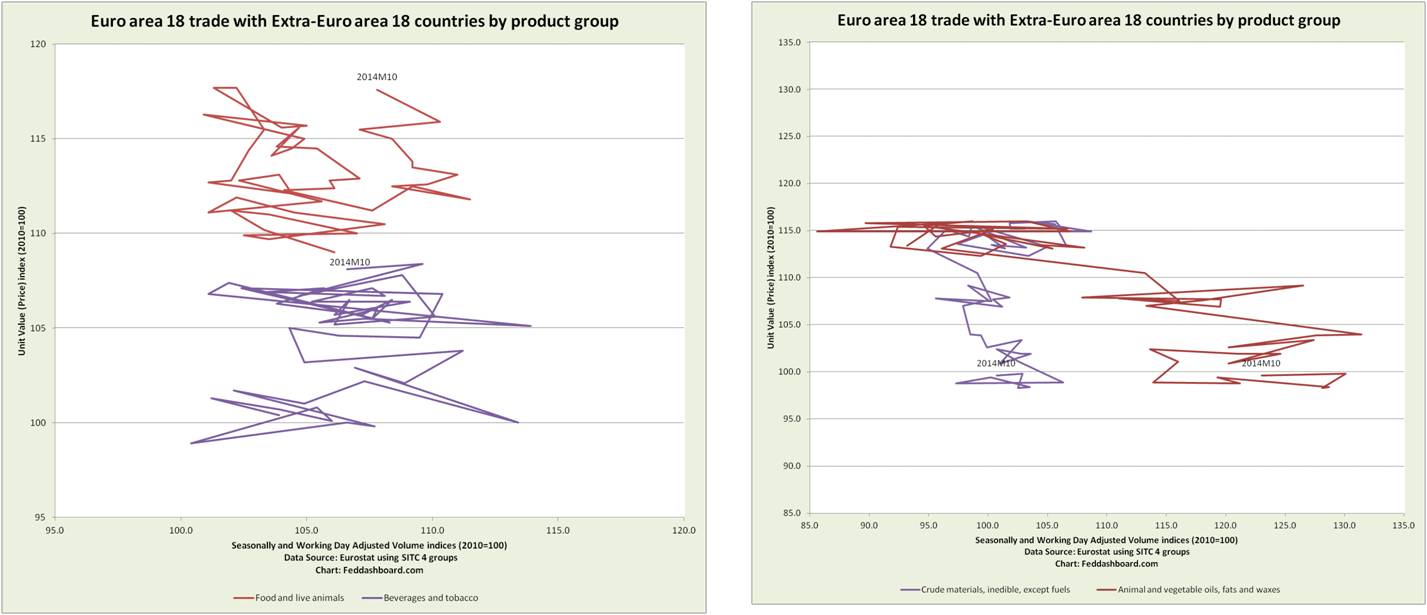
 Applying the “World to U.S., ‘Do you get globalization yet?’” approach to Euro area data, provides time tracks of month price-quantity combinations. To focus on recent concerns, these charts start at January 2011 (Eurostat data series begins in 2000). Even in broad groups, data have divergent patterns. Food, drink and tobacco import prices (left chart) have been recently increasing whereas raw materials import prices (right chart) have been mostly decreasing.
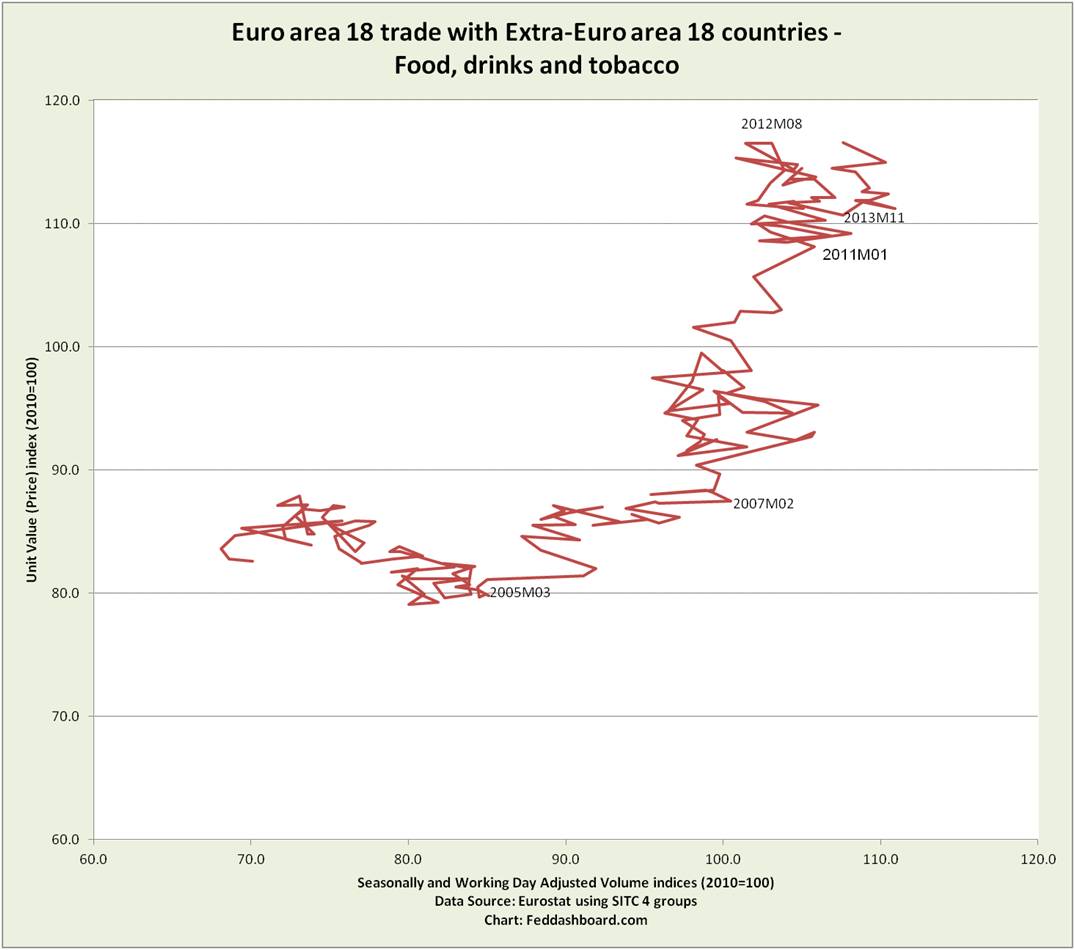
 The time track for Food, Drinks and Tobacco entirely shifted behavior in different periods since 2000. Demand for the past year has been greater than the prior year — and with increasing prices. This is one of many distinctive product stories. This picture cautions against “shotgun” monetary measures that miss different causes across time and products.
 Working with European data is more complicated than with U.S. because of piecing together national data, rolling trade pact implementation, price controls and more.
Country-Level View
Detail more similar to the U.S. analysis in “Is this the Fed’s inflation trap?” is seen in a country household view, such as the U.K.
Here, different price-quantity time tracks reflect different stories.
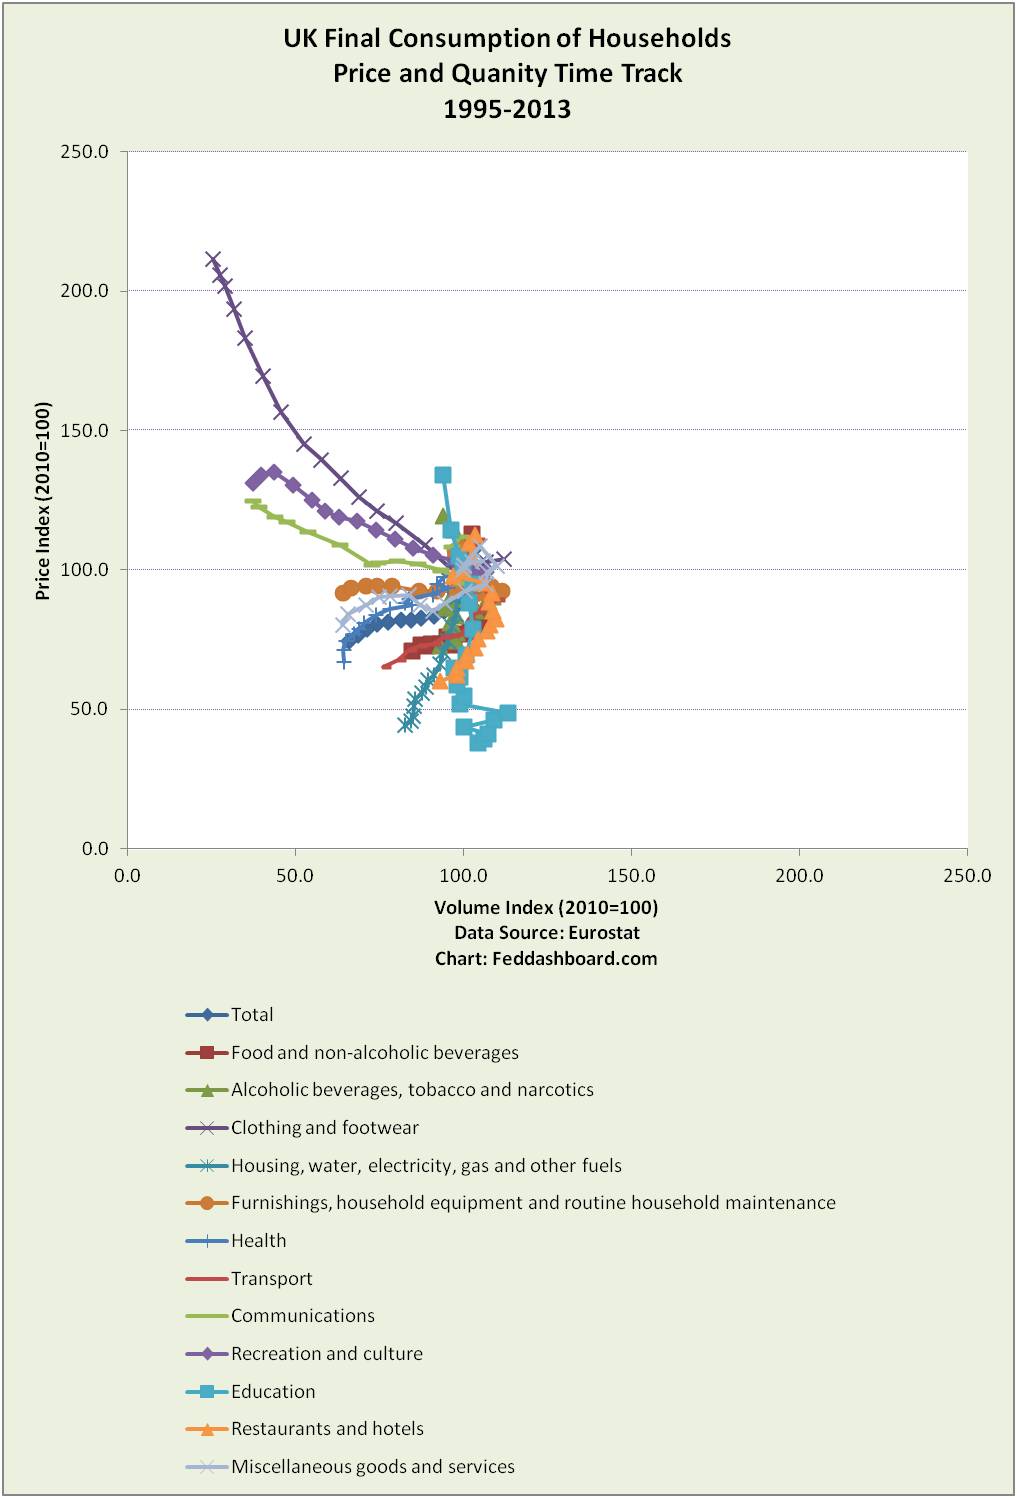 A simplified view hides yearly variation, but highlights price changes over nearly 20 years.
 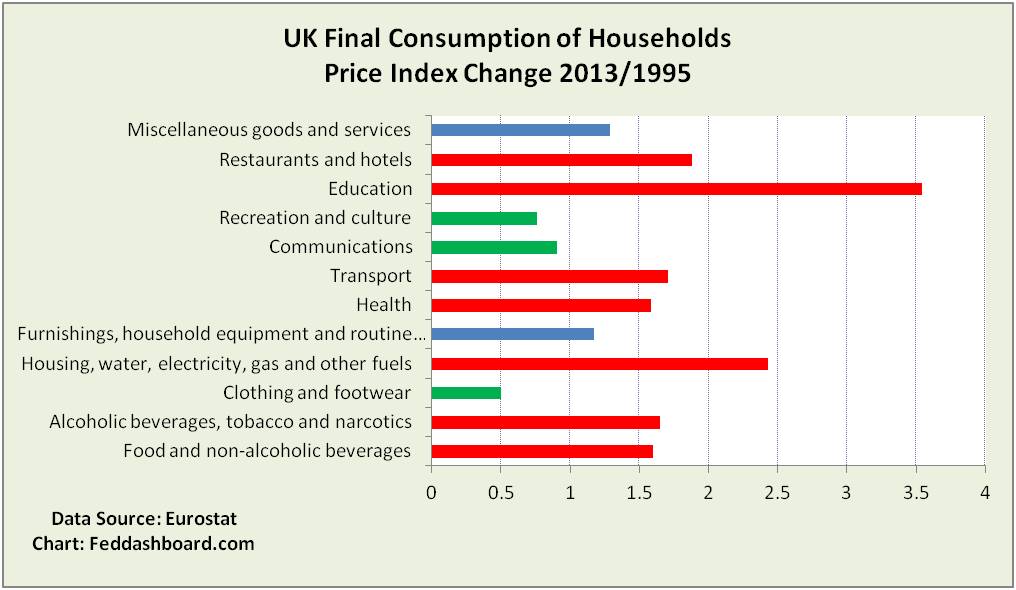 Red bars are consumption purposes greater than average. Average is a factor of 1.45 or about 2% per year. Green bars are price decreases.
As with the Euro area view in “Decoding Eurozone Deflation,” causes reflect the PIPE factors plus local supply and demand, price control, regulatory policy and more.
Decoded deflation reveals a wide range of policy options – starting with policies currently in effect. At the same time the question is raised, Can economic growth be fostered by trying to raise iphone prices or further inflate education?
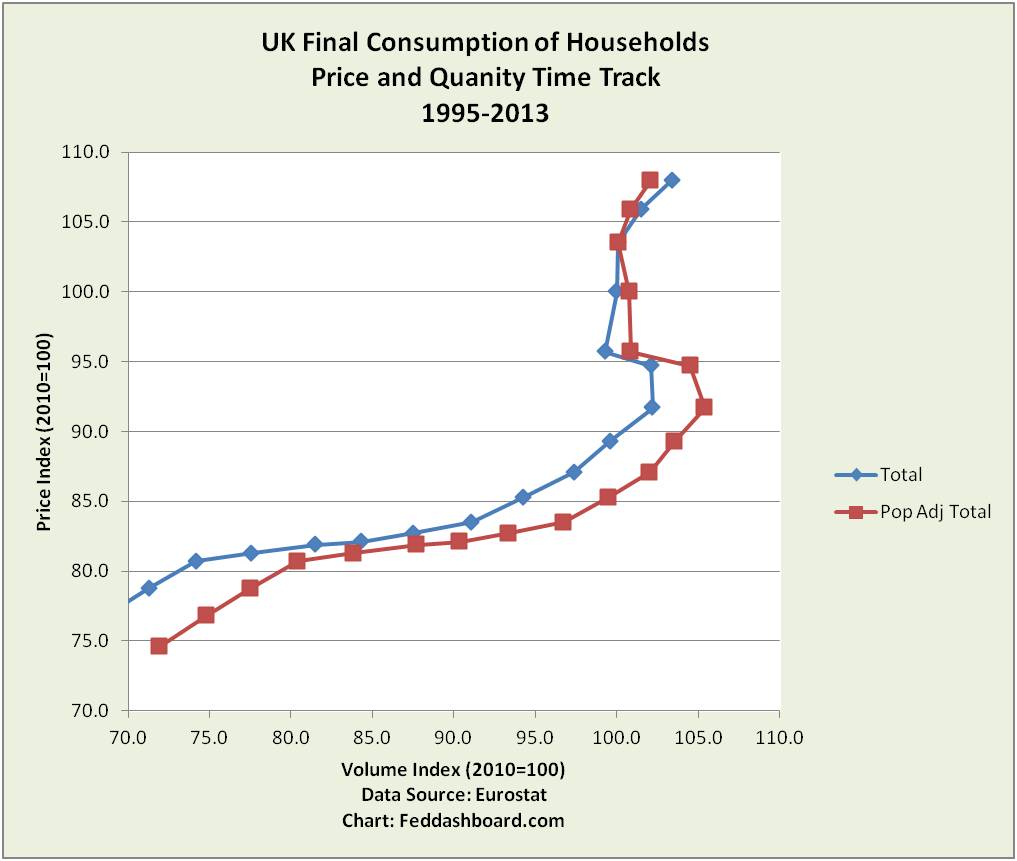
In U.S. monetary policy, we’ve noted how domestic destiny has been derailed by demographics, deleveraging, dilution and disjointed regulation. In the U.K., adjusting for population illustrates demand is weaker than typically reported – details matter. The 4C consumer demand details also matter, such as deleveraging or returning to consumption preferences of a prior era of “good enough.” For a U.S. view, see “Housing – Updraft, Not Headwind,” February 2015.
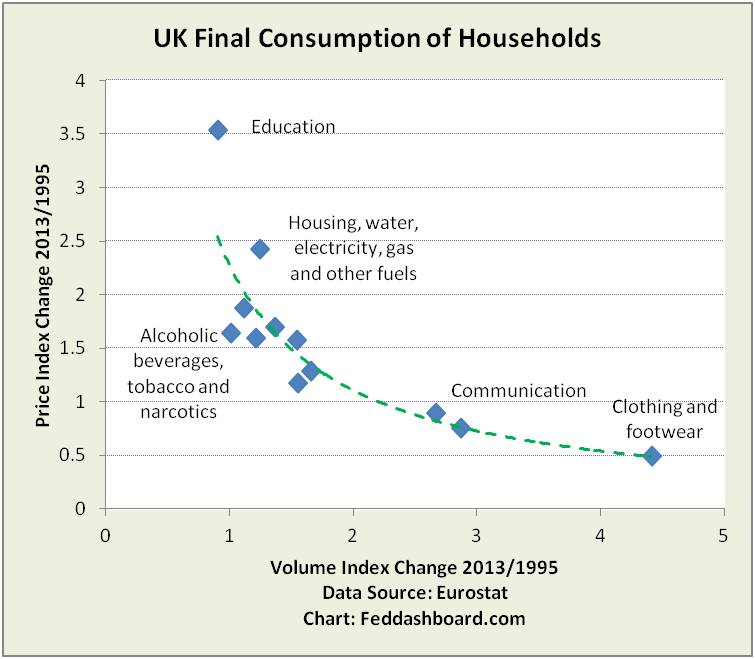
 Finally, nearly 20 years of data illustrate lower prices go hand-in-hand with greater demand.
  In closing,
- Decoding “deflation” reveals causes in: 1) globalization in PIPE factors; and 2) local supply and demand, and government policy.
- While “structural” reforms are debated, it is not clear how well these are being related to causes of price changes.
- PIPE factors increasingly restrain prices and wages. While protectionism and war could reignite, exponential technology with its ability to grow capacity and compress space-time will probably march on.
Rather than trying to fight Minecraft, the ECB might use Minecraft to better understand these dynamics. Memo to Mario Draghi: Watch out for creepers.

