4 February 2015
Decoding Eurozone “deflation” from a mysterious demon to products people touch each day finds deflation not so widespread, not always unique to the Eurozone, and difficult to fix for the European Central Bank’s (ECB) latest asset purchase program. It might be easy to pump air into a leaky tire, but trying to drive fast on an inflated, yet bald tire might just make a skid mark.
Causes matter in responding to price changes. Is a lower price on a smart phone or clothes washer bad? “Inflation” – strictly speaking – is about general price increases across goods and services. This is in contrast to a specific price increase resulting from changes in supply and demand for a specific good or service. (For more specifics, please see Is this the Fed’s inflation trap?, August 2014.)
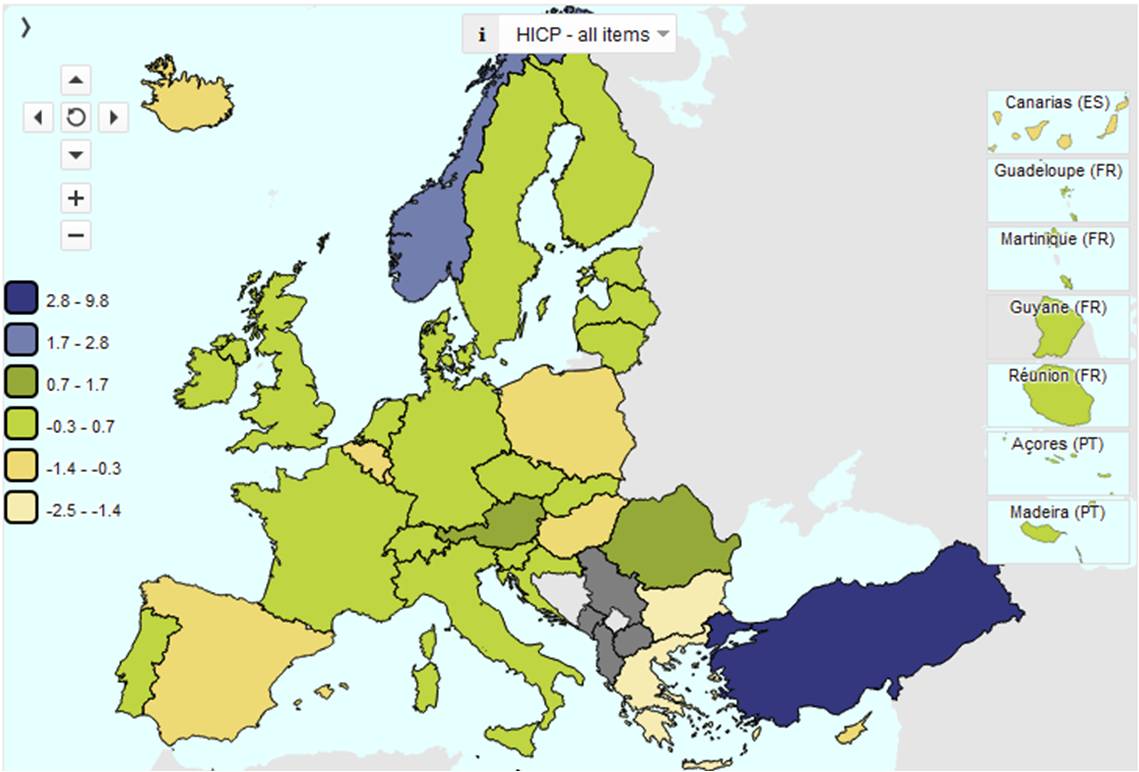
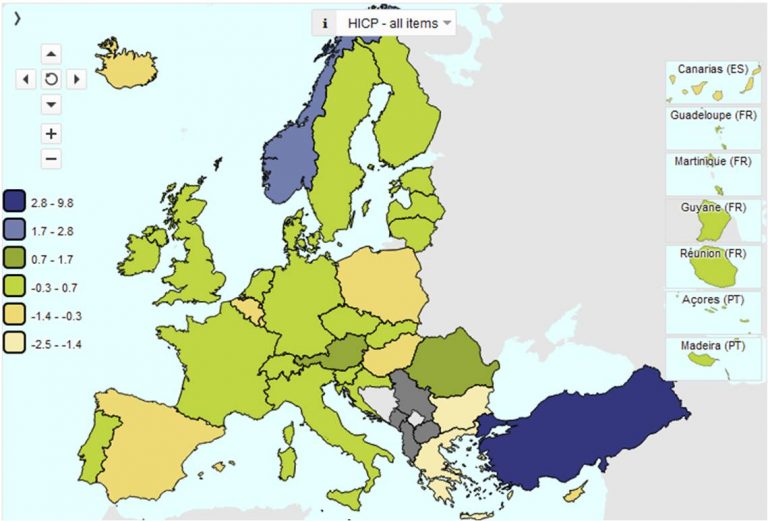
For the Eurozone, Harmonised Indices of Consumer Prices (HICP) are provided by European Commission Eurostat for geographic areas and products.
 Eurostat animates this map at http://ec.europa.eu/eurostat/web/hicp and combines price changes with weights by component at http://ec.europa.eu/eurostat/web/hicp/inflation-illustrated.
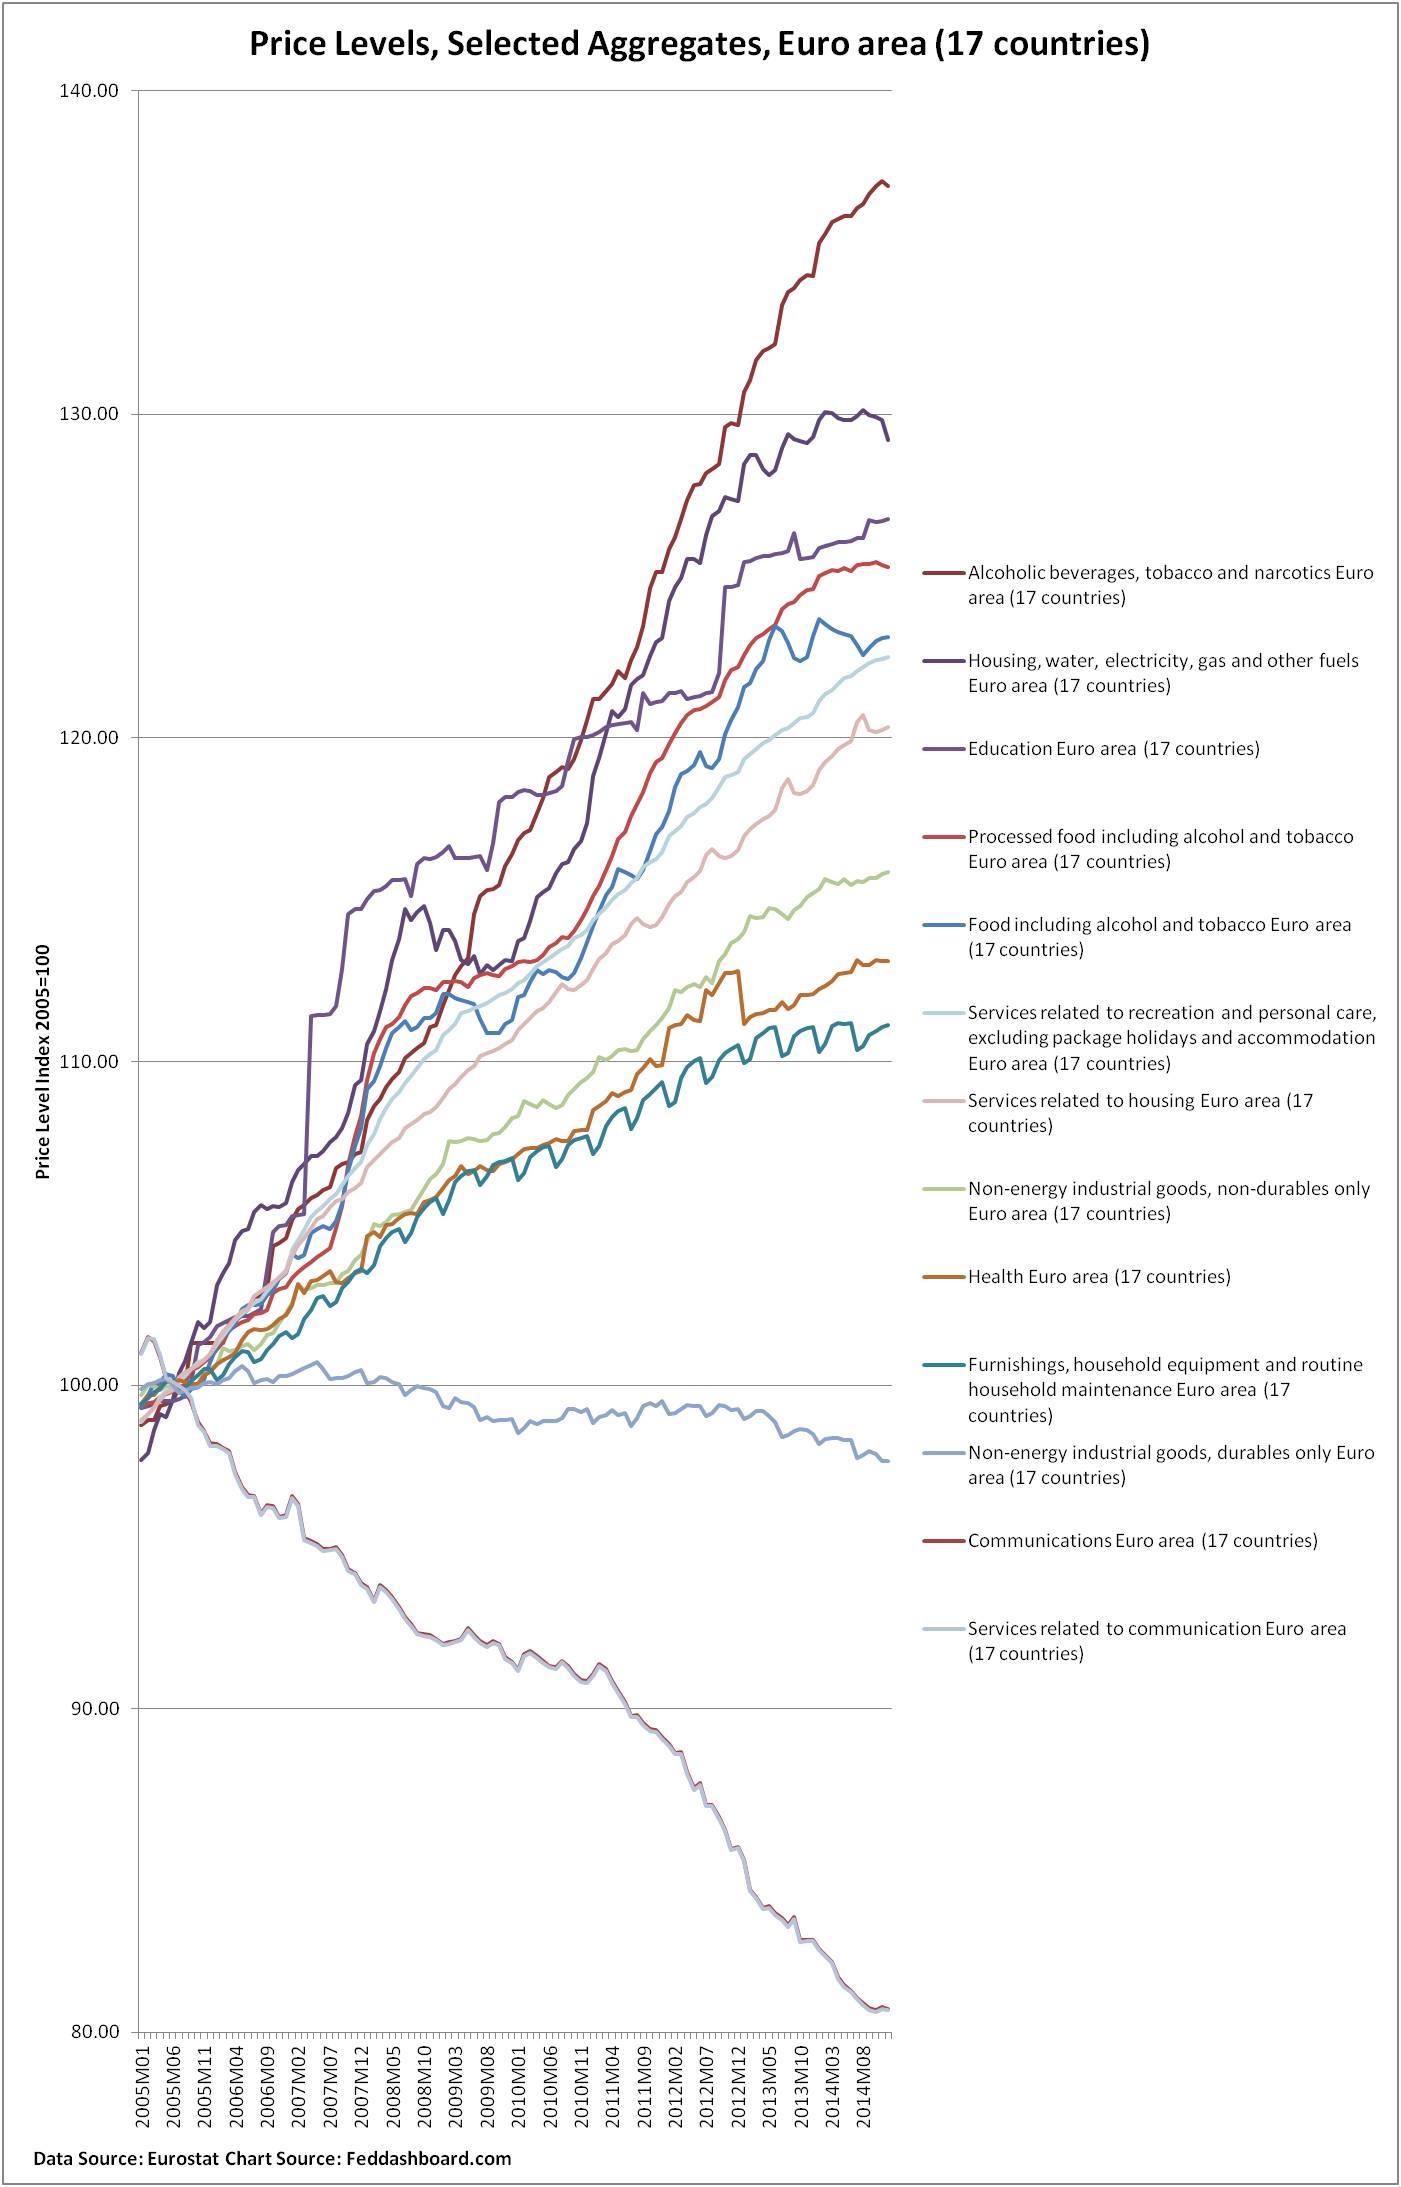
Using our approach from Better investing by better understanding sources of inflation, June 2014, it helps to picture prices by product groups. In the product group view, to avoid seasonal squiggles obscuring a graph, items such as clothing, recreation and culture, restaurants and hotels are first removed. Also for clarity, most energy-related items are removed. Back to these later.
 To read the picture, realize that each category is shown as an index with a 2005=100. As the data also starts with 2005, if the most recent data point is just below the 120 grid line, bang, that’s about the 2% annual inflation target.
For clarity given all the lines, here are the rankings…
130+
- Alcohol, tobacco & narcotics – discretionary
120-130
- Housing & utilities – until recently just above 130
- Education – highly government policy driven
- Processed food, including alcohol & tobacco
- Food, including alcohol & tobacco – unprocessed and seasonal food dropped from summer 2013 to summer 2014, spiked up to November and dropped in December
- Services related to recreation and personal care – discretionary
- Services related to housing
110-119
- Non-energy industrial goods, non-durables — significant annual pace of 1.7% even though restrained by globalization as in the U.S., see World to U.S., “Do you get globalization yet?”, December 2014
- Health — highly government policy driven
- Furnishings and household equipment – significant price increase compared to U.S. where prices dropped, see Is this the Fed’s inflation trap?, August 2014
Below 100
- Non-energy industrial goods, durables – restrained by globalization
- Communications goods and services – restrained by technology and globalization
In short, lower prices for these groups are mostly about globalization, technology and government policy. Monetary policy doesn’t change the causes. Mostly, monetary policy can increase prices by devaluing the Euro so imports are more expensive as measured in the Euro. Yet, this cuts purchase quantity on more price-sensitive imports.
Energy
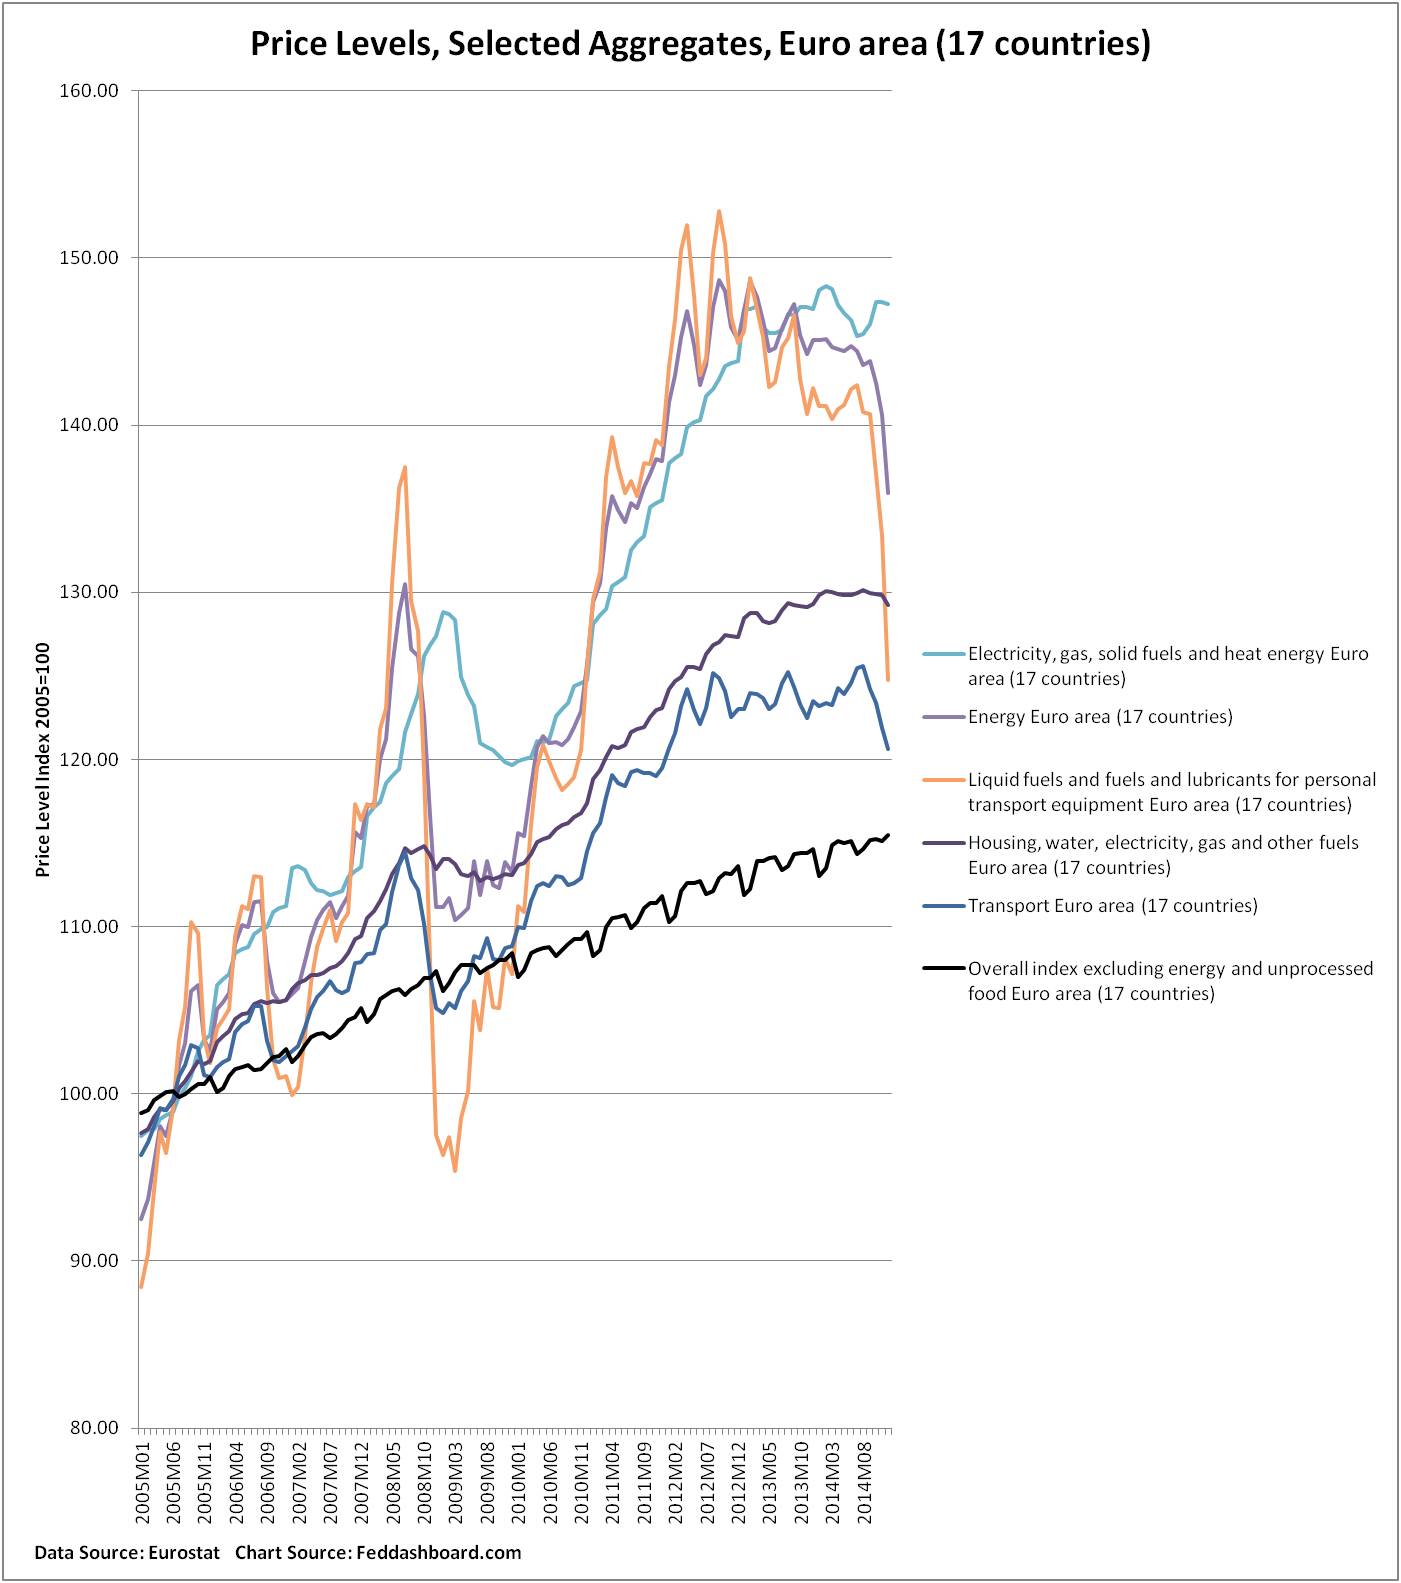
Several groups including energy are shown – liquid fuel plummets.
Importantly,
- Liquid fuels annual average since 2005 is still well above the 2% target
- Overall index excluding energy and unprocessed foods (black line) has a price increase of over 1.5% per year, although the rate of price increase has slowed since late summer 2012.
Change month-over-prior-year-month (y/y) reduces seasonality so it is easier to see patterns:
- Clothing and footwear index is up just 1% since summer 2012 with decreasing monthly y/y increases. Yet, the Euro area is significantly higher than the 1% drop in U.S. CPI-U Apparel.
- Recreation and Culture came out of the recession with prices increasing to a spike of over 2% in early 2013, since then price increases tempered to a flat 2014 similar to the 2006-2007 experience.
- Restaurant and Hotels prices had been rising since 2010 at about 2% and then slowed at the beginning of 2014 to rises of just over 1.5%.
- In each of these products, specific market segments have different dynamics. Those segments more price-sensitive to imports will see purchase quantities fall.
Contrasts are significant
It’s tempting to compare EU and US overall price indices, and then point to differences. Yet, this misses contrasts in government policy in broad structural areas and specific industries. Of course, behind each structural reform (labor, trade, price controls, business climate or tax) is a question of government and popular will to reduce economic protections for some groups so the economic pie can grow for all.
ECB Objective
With all this data in mind, consider the objectives of the new asset purchases. In opening his 22 January press conference, ECB President Mario Draghi stated, “Looking ahead, today’s measures will decisively underpin the firm anchoring of medium to long-term inflation expectations.” Later, “Taken together, these factors should strengthen demand, increase capacity utilisation and support money and credit growth, and thereby contribute to a return of inflation rates towards 2%.”
While there are several theories about how such monetary policy will unfold, the emphasis of Mr. Draghi’s statement seems to be the hope that buyers will see rising inflation and spend today rather than tomorrow — even in the face of needed “balance sheet adjustments” and uncertainty.
Yet:
- Buyers today have adjusted to shopping with different price trends — housing is climbing while big TVs falling. The assumed “anchoring” may no longer work as it did in the past.
- Historically, “easy money” created inflation when too much money chased too few goods. No shortages today, as Mr. Draghi also noted.
- Spending and investment happens in response to catalysts of confidence. An open behavioral question is whether people will view monetary action as a catalyst of confidence or sign of desperation.
Thus, importing inflation through devaluation seems the most likely monetary outcome.
Investor Insight
In the near term, monetary policy bubbles are good for the equity market prices. President Draghi observed “…the monetary policy measures adopted between June and September last year resulted in a material improvement in terms of financial market prices…”
Fundamental perspective:
- Equities and corporate debt are likely to rise.
- For Euro area companies, dangers lie in coping with distortions. For example, those for companies that buy inputs globally for local sale, or whether losses from devaluation will be offset by gains from exports and financial asset price increases.
- For companies outside the Euro area, investors will need to consider effects on exports to Euro area and earnings conversion.
- For any product, buyer price sensitivity is important.
- Further distortions and market shocks such as the current crisis with Greece will exacerbate the issue of spurring growth or avoiding deflation.
Mr. Draghi again documented for posterity the limits of this action, “However, in order to increase investment activity, boost job creation and raise productivity growth, other policy areas need to contribute decisively. In particular, the determined implementation of product and labour market reforms as well as actions to improve the business environment for firms needs to gain momentum in several countries. It is crucial that structural reforms be implemented swiftly, credibly and effectively as this will not only increase the future sustainable growth of the euro area, but will also raise expectations of higher incomes and encourage firms to increase investment today and bring forward the economic recovery.” (emphasis added)
Given limits of quantitative easing and need for structural reforms, watching for warning signs of distortions is the priority.
For investors, it is particularly important to watch for bubbly financial asset prices becoming a eurozone bald tire skid mark.


