
8 March 2015
S&P500 company average sales submerged in 4Q2014. This was an unusual quarter with Apple pulling average sales up and oil companies pulling it down. Companies with sales decreases – beyond oil – were the sales submarines.
Like any average, the sales average hides details. For investors, it is especially bad to miss detail when company performance varies widely. Sales submarines can’t be avoided unless they are tracked individually.
The Zacks Investment Service S&P 500 ETF composite makes this data available and Zacks Research System makes it easier to see the pattern.
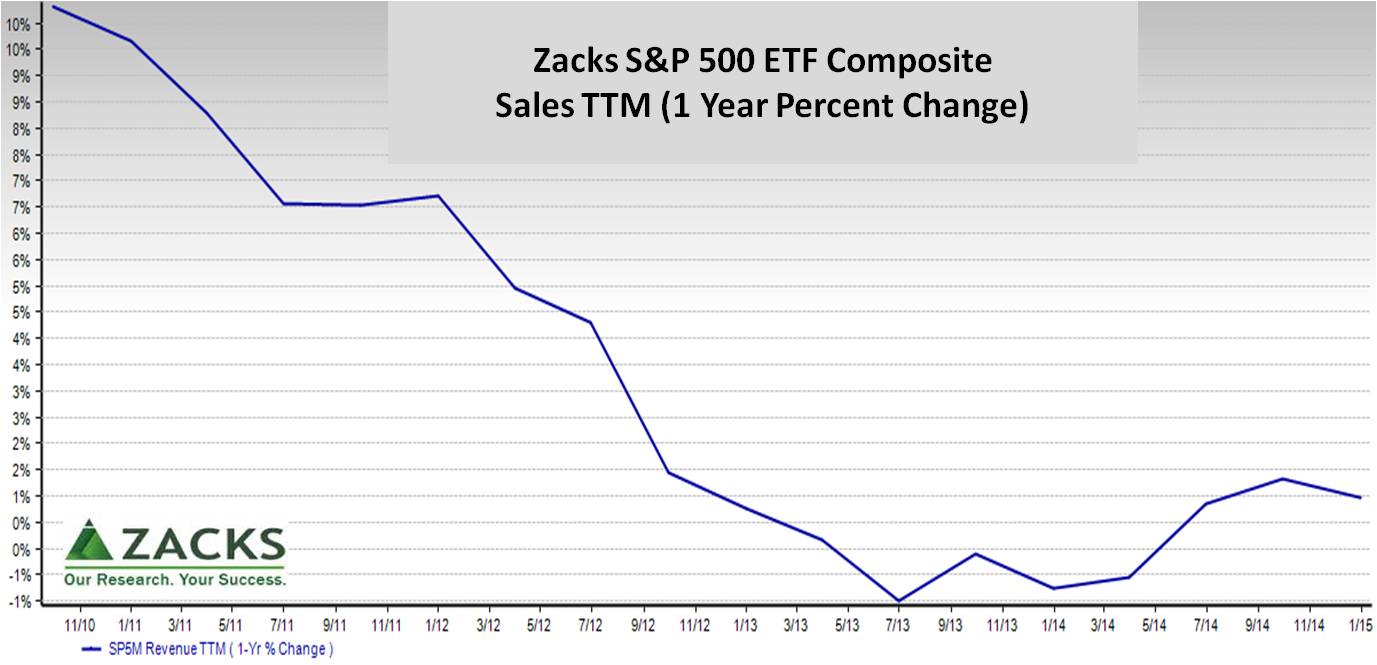
Measuring quarter over year prior quarter, an upturn started just over a year ago. The next two quarters struggled to stay ahead of inflation. Then, the two recent quarters were clearly ahead of inflation. Now, it’s down.
Measuring trailing twelve months (TTM) provides this quarter-smoothed picture from ZRS.
 As described in, “Will 2015 herald a renaissance in “actual alpha” investing?” December 2014, there are qualifications to equity index composites.
- First, index members come and go. Zacks’ composites control for member changes.
- Second, index combined revenue grows when members acquire nonmembers and shrinks when divesting.
On net, there is still some lift from healthier companies surviving and acquiring.
Thus, we want to see a bit of growth in composites beyond inflation to declare a quarter a winner. And, company specifics matter.
Zacks Research System gives us a view of individual company performance.
Measured quarter over year prior quarter, sales change varies widely by market capitalization.
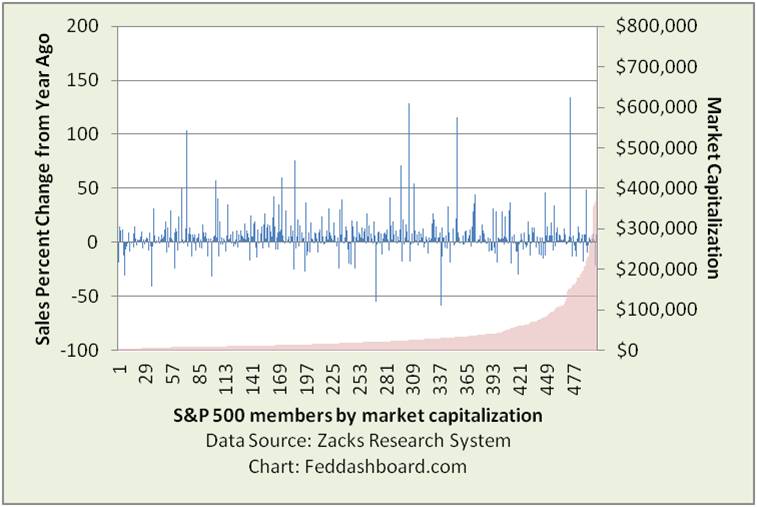 About 66% of companies had real (inflation adjusted) sales growth in 4Q2014. This was just below the 70% of 3Q2014 and same as the 66% of 1Q2014.
Good news that most companies are up, especially good when sales were organic.
Still, investors are seeing on Zacks sonar that 1/3 of board members and CEOs are sailing ships that are unintentional sales submarines.
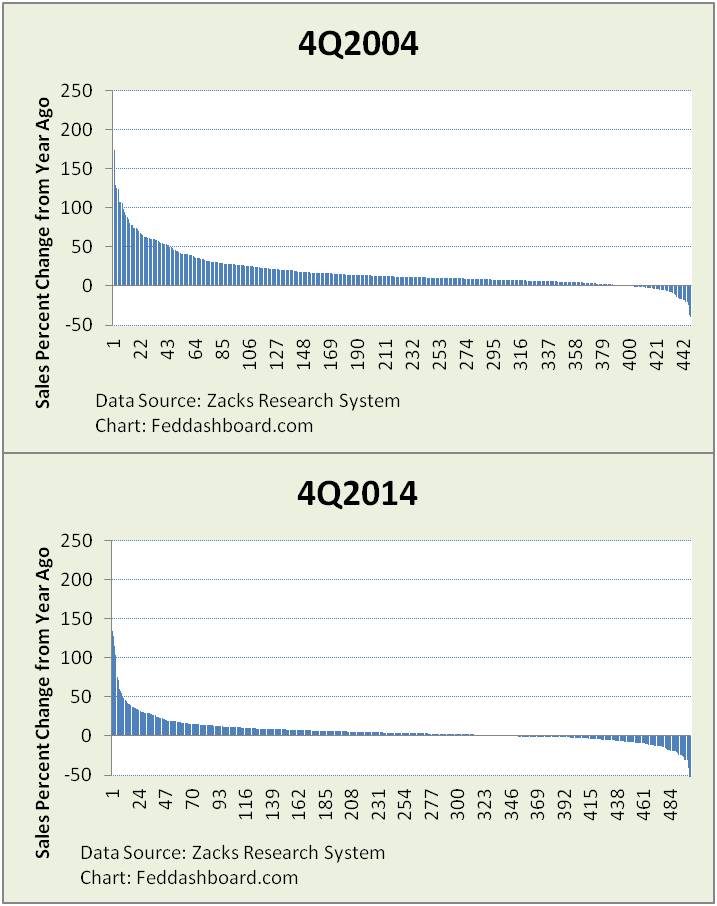
Exactly 10 years ago, only ¼ of companies were sales submarines.
On an equal-weight basis and after inflation, in 4Q2004 average growth was 10% and the median company was about 7%.
Today average growth is not quite 0.9% and the median company growth is about 2.8%.
Over the decade, the distribution has flattened and more companies are more strongly negative.
 Investor Insight
- Data show distinct differences between companies that 1) grow sales versus 2) sales submarines that at best engineer earnings.
- For value investors, this view of sales differences:
- Reinforces how business models are changing — also seen in physical asset differences in “4Rs help you see the shift,” February 2015.
- Suggest sales as a measure of sustainability of a company’s business model.
- For investors eager to search for reward, tools like Zacks can uncover opportunities.
For any true fundamental investor, it’s about buying business models, beyond managing market moves.