
3 March 2015
Business models of companies have shifted over the past few decades. Yet, fundamental analysis hasn’t really matched the shift. 4Rs can help.
Data pictures show the shift how companies are increasing sales while using fewer physical assets.
Through the eyes of Zacks Research System we can easily see the changing relationship in S&P 500 companies between Property, Plant and Equipment (PPE) investment relative to Net Sales and then growth in Net Sales over the following two years. The 2012 view reflects sales change from 2012 through the just reported 2014 results.
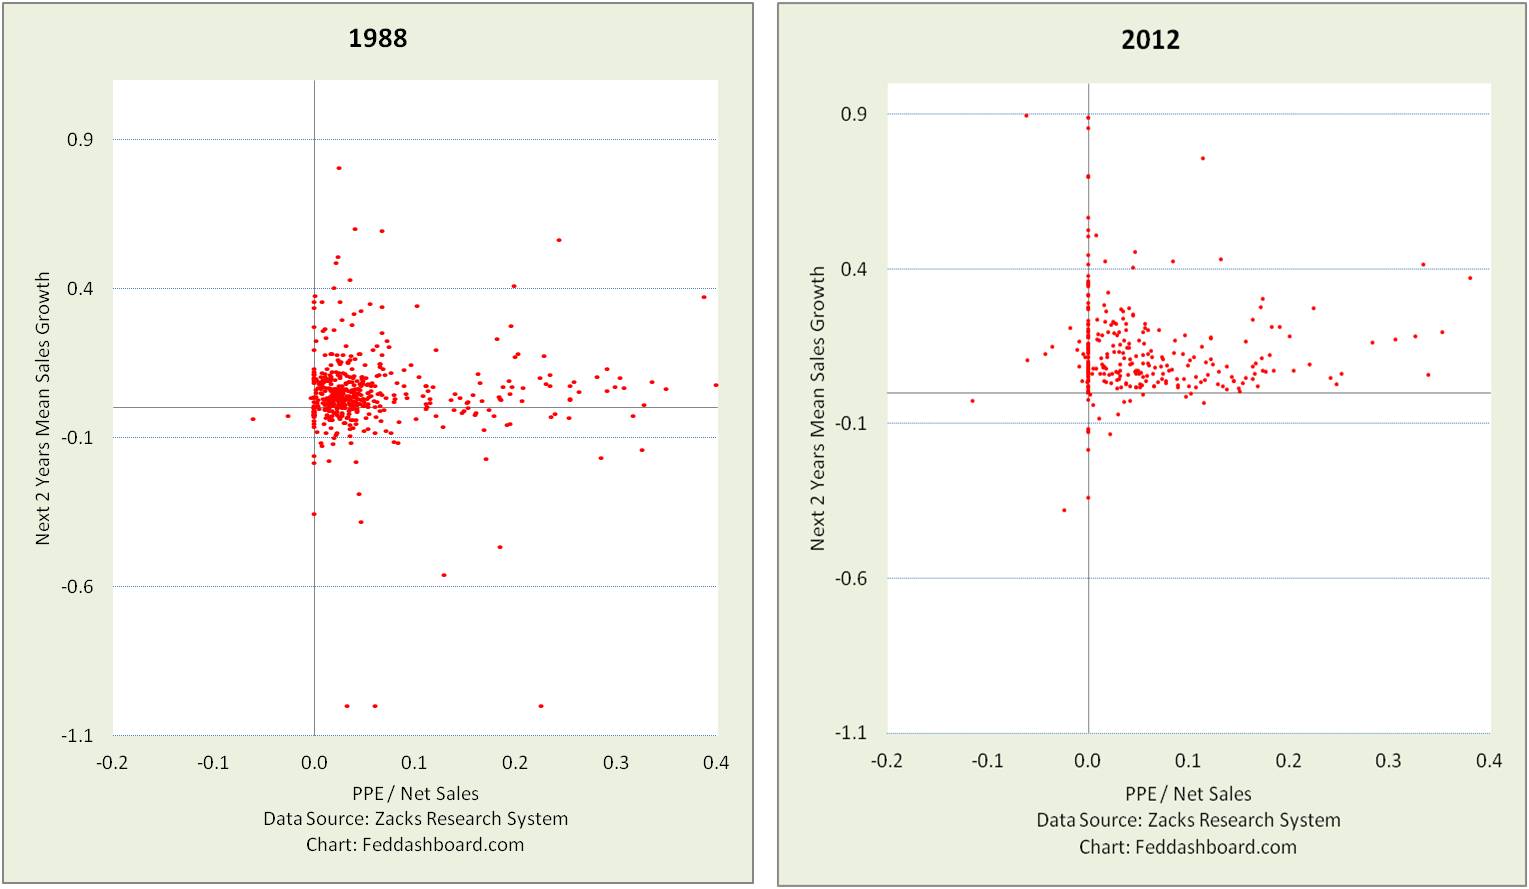 Today, striking is how little PPE is used to produce sales growth.
Gone is the 1988 cluster. PPE/Net Sales now hugs zero for many companies.
The ratio of PPE/Net Sales in 2012 was about 25% less than in 1988. The average drop may well be moderated by strong 2012 PPE/Net Sales in oil & gas and utilities.
Business Model Investing is built on understanding shifts in our economy and companies in order to both broadly encourage growth and benefit from it as investors. You’ve seen this in previous commentaries, including:
- Will 2015 herald a renaissance in “actual alpha” investing?, December 2014
- Situation status and organic growth imperative, October 2014
- 3 insights for corporate cash – finding health, September 2014
As it is valuable to read company data together with macroeconomic data, just click though prior macroeconomic commentaries to more fully see structural changes between these two time periods.
Business model shifts to the value of the idea
- Investors need to determine what low PPE/Net Sales actually means. Does it reflect cuts in competitive capability, outsourcing, REIT creation or financial engineering? Or, does it reflect thoughtful business model change?
- Investors evaluating “thoughtful business model change,” might examine exactly how a company creates value within its network/extended enterprise.
- As PPE is decreasing, so is labor. Conventional economic data sees these drops as increasing returns to passive capital investors. This is partially true, but much of the recent boost is due to central banks inflating equity prices. Yet, macroeconomic data doesn’t see shifting returns to entrepreneurial ideas.
As business models change so must fundamental analysis measures
In Business Model Investing, given changing economics, the 4R measures might well help bring clarity to change:
- Rare – scarce is valuable. For example, today revenue is scarce, 15 years ago net income was scarce
- Right – financial statement line items less subject to manipulation
- Reflective of powerful and durable value position
- Relative for each measure to: industry, sector and economy
More Insight
- Changes in models and thus appropriate measures were emphasized in our “Market Myths” webinar for the Retirement Income Industry Association, February 2015.
- Complications faced by investors in market measures were also discussed in 3Q Earnings Season Preview – Zacks dashboard, October 2014