
10 April 2015
Decreases in labor productivity have been puzzling. Investment in Private Structures is the fixed asset type that has dropped most relative to hours worked. This matters because at any output level, if assets are lower compared to hours worked, productivity drops. For investors, understanding the implications helps spot opportunities.
Labor Productivity is output divided by hours worked. At Q42014, output was down and hours worked up. Thus, productivity – the space between the lines – fell.
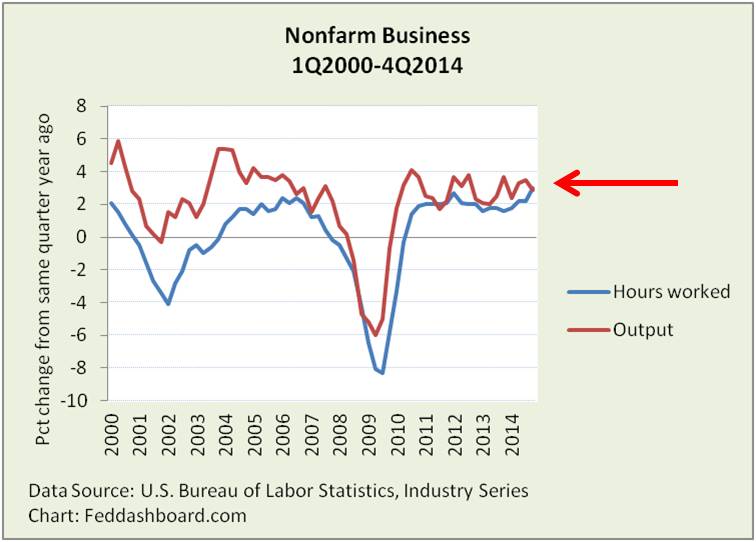 On average, the space between the lines – productivity — is smaller after the credit bubble burst than between the bursts of the dot com and credit bubbles. What’s changed?
As the U.S. Bureau of Labor Statistics (BLS) notes, Labor Productivity reflects “…many influences, including changes in technology; capital investment; level of output; utilization of capacity, energy, and materials; the organization of production; managerial skill; and the characteristics and effort of the work force.” This is the space between the lines.
Structures stall amidst structural shifts
Expanding on “Y2K – When workers hit the wall” and other analyses, we now peer into types and amounts of assets through the lens of the U.S. Bureau of Economic Analysis (BEA).
The BEA has three buckets of fixed assets: equipment, structures and intellectual property products. The share of each in an industry varies dramatically. For example, in 2013 (most recent annual data available), intellectual property products are less than 2% in food service and over 80% in publishing (including software). Other examples include:
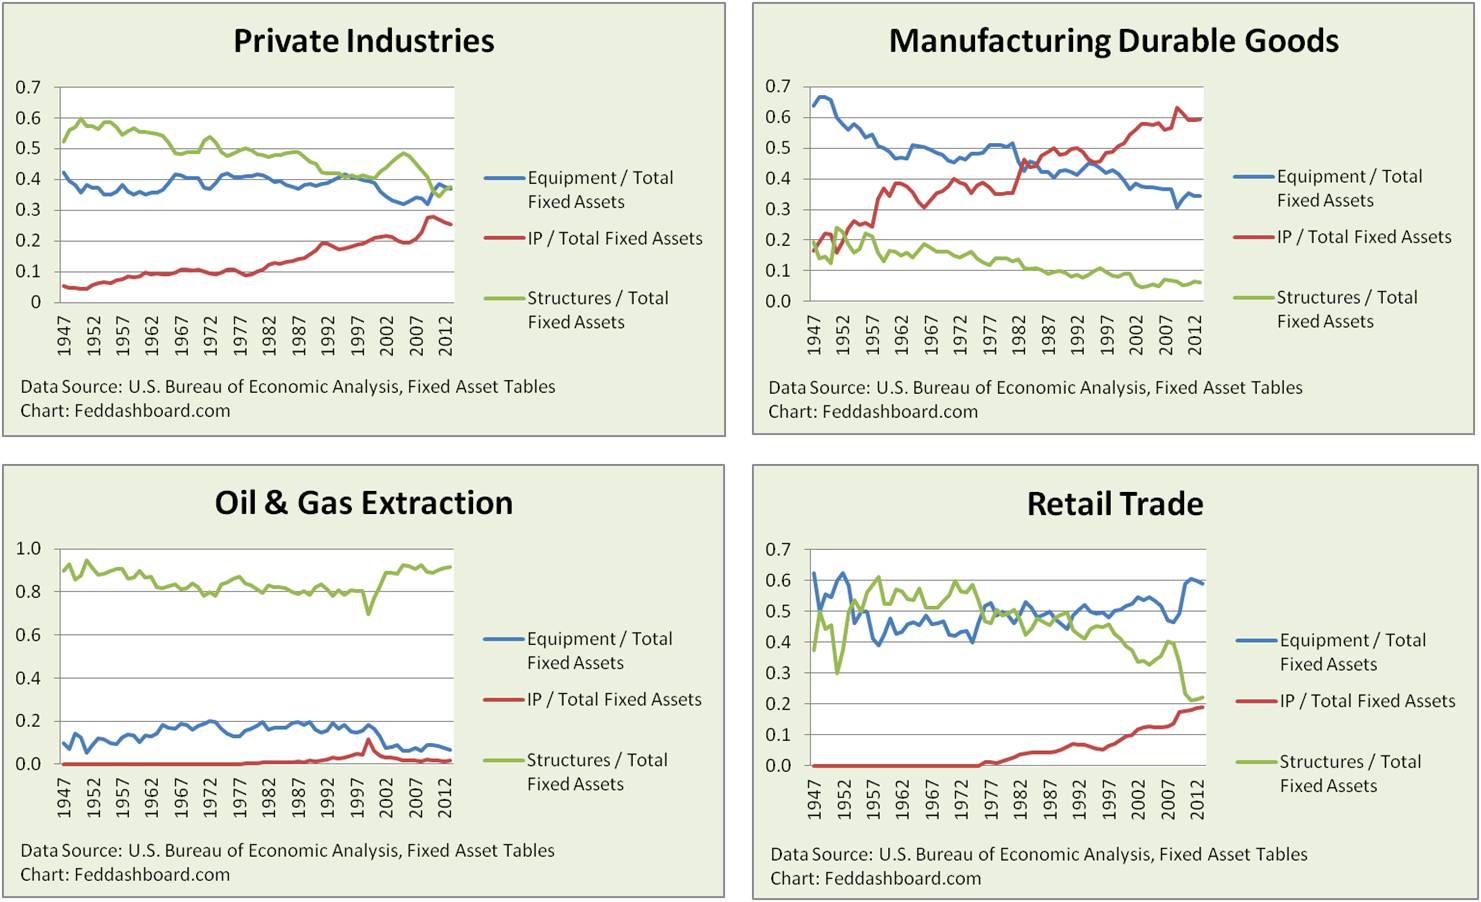 For labor productivity, the data detective question is, “How does the quantity of each asset compare with hours worked?”
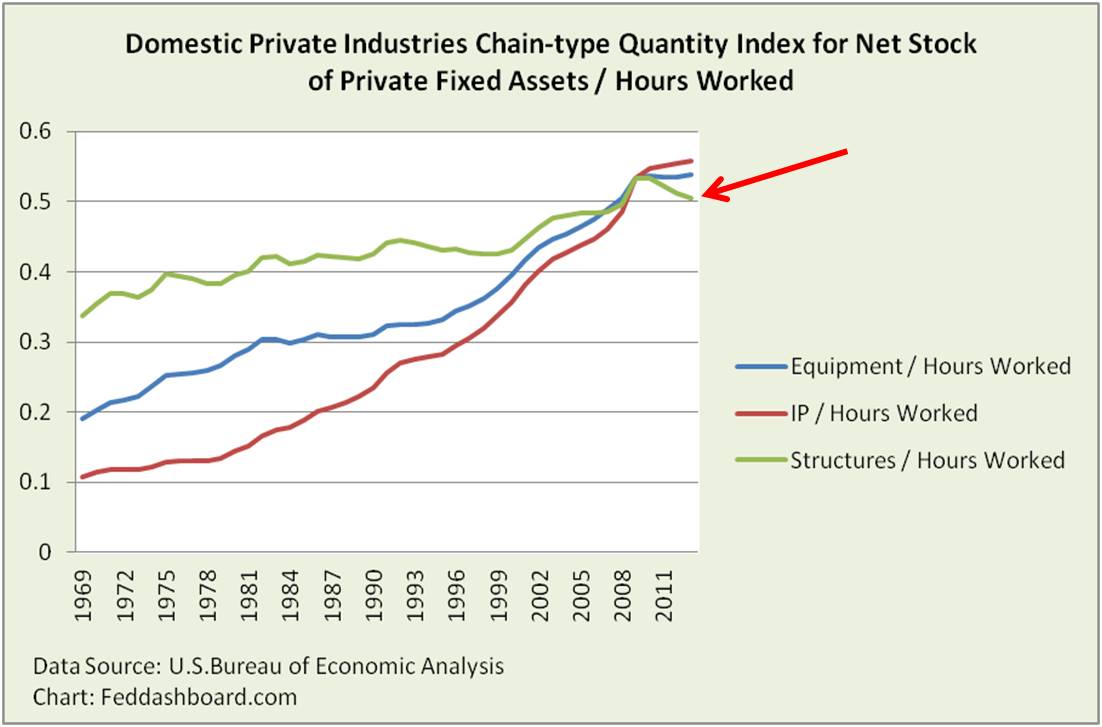 Structures since 2007 have been growing very slowly. Relative to increasing hours worked, structures dipped. From the BEA data, most industries are weak. A few industries such as mining, durables, transportation (air, water and pipeline) and food services are growing strongly.
Why are structures struggling? A frequently cited shorter term cause is lack of confidence. Cutbacks in oil and gas projects are examples. Longer term causes include technology. For example, power plants and data centers have extra floor space as the physical size of productive equipment shrinks. Even factories for fixed-sized products, such as cars, can be redesigned for efficiency.
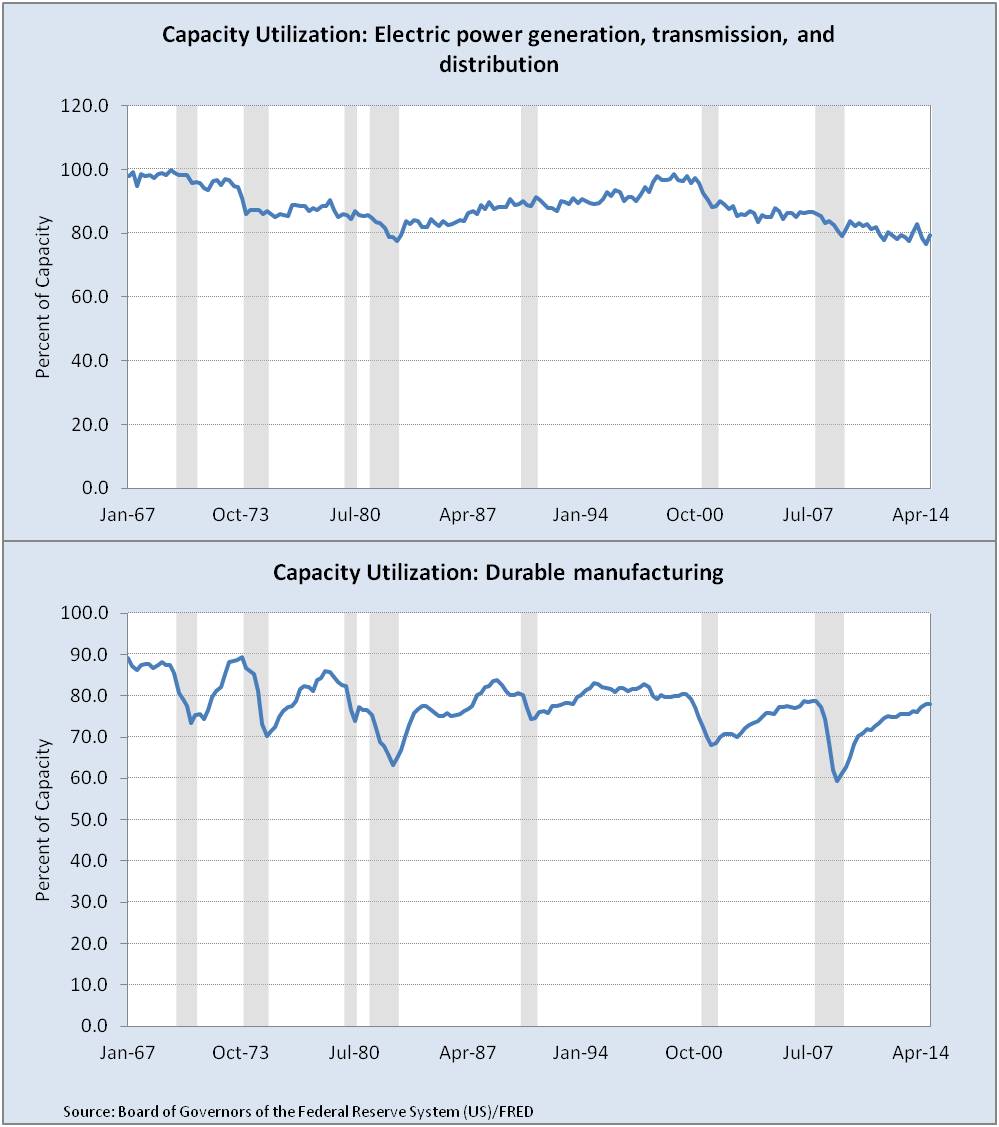
How long has capacity been increasing?
Productive capacity grows with exponential technology
Capacity utilization measures are provided by the Federal Reserve Board. While rising and falling with economic conditions, utilization has been on a downtrend since 1967 – falling from nearly 89% to nearly 80% as of 4Q2104. Industries vary widely. Today, textile is at about 68%, and oil and gas extraction is over 95%. Electric power capacity has been considered a barometer — it has fallen from near 100% in 1998-2000 to about 80%.
 Economy of ideas
What’s the spark for this exponential technology that grows capacity? Generally called “innovation,” it is measured to some degree in Intellectual Property Products. This concept is also called the economy of ideas. The emphasis is on idea because an idea can quickly jump to finished product via exponential technology. This capacity is measured in creative brain space rather than manufacturing plant space. This is explored at organizations such as Singularity University.
As the BLS definition notes, some “between the lines” influences are related to organization, especially management method. The creation and change to new management methods is itself a management method.
Measurement matters
Productivity measures are affected by how services and materials are sourced. When sourced from outside of a company, industry or country those hours worked move to a different accounting bucket and thus appear to improve labor productivity. Sourcing from other countries includes both technology and less costly labor using technology. The import influences are measured by the BEA as described in the “Red Dots” story. Bringing work back in-house lowers measured productivity.
Multiple data sources are needed to see between the lines. Here, BLS, BEA, Fed, Census and SEC (via Zacks Research System) data are blended.
For investors, superior insight into company productivity creates opportunity
Companies – including direct competitors — differ in shifting between working hours or fixed assets. For example, one company may be adding workers to fix problems created by excessive cost-cutting whereas another is adding workers to expand use of available factory capacity.
Investors can find opportunity in causes of differences.
- Positives are the creation and use of signature strengths that add people. These initially decrease measured productivity.
- Negatives include “lean” corporate initiatives that cut too deeply forcing more risk onto investors – in addition to strained share price levels. These initially increase measured productivity.
For investors, the question is whether a cause has sound strategic reasons or just earnings engineering (any earnings divided by fewer assets will boost Return on Assets).
Insight for action comes from business model investing methods such as the 4Rs using tools such as Zacks Research System to understand sales submarines and cash flow relative to fixed investment.
Summary
We do:
- Not need to fear lower productivity that is the result of long term asset shifting, or growth in hours worked reflecting economic confidence or better management.
- Need to be cautious of distorting policy and management gimmicks.
- Need to understand the dynamics of the idea economy, exponential technology and related trends.
Analyzing the shifting asset mix provides pointers for investigating company business models. The more diverse are companies, the more business models matter to investing.