23 April 2015
Businesses create about 75% of the value in our economy. Knowing how company earnings map to economic data helps investors gauge strain and find opportunity.
“Consumers are 70% of the economy” is often heard. If so, how does business matter? How do company earnings releases matter to economic data?
In “3 Ways to measure consumers in our economy,” we looked at the 3 ways the economy is measured in National Income and Product Accounting (NIPA) by the U.S. Bureau of Economic Analysis (BEA). The 3 are: final expenditure, income and value added – all in the BEA’s NIPA Table 1. Each approach totals to Gross Domestic Product (GDP).
Final Expenditures
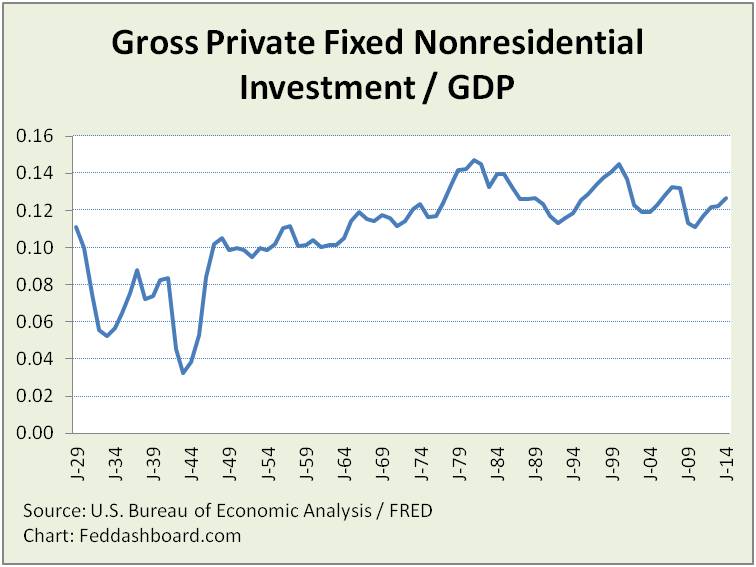
“Consumers are 70% of the economy” comes from the final expenditure approach. The spotlight is on consumers because, by definition, businesses don’t do final consumption; businesses invest and produce. Businesses appear mostly in private fixed nonresidential investment.
 Gross (before depreciation) private fixed nonresidential investment as a share of GDP has been on a fluctuating downtrend since the late 1970s; in 2014 it was still higher than any year prior to that time.
Insights from fixed investment trends were highlighted in “Read between the lines to solve the productivity mystery.”
When this measure is added to private fixed residential investment, consumer expenditures, government and net exports the total is GDP.
In earnings releases, capital expenditures plus intellectual property investments (such as research and development) map to fixed investment in economic releases. As a nuance, the BEA often pulls data from the IRS rather than SEC.
If this is the spending side, then what’s the income view?
Income
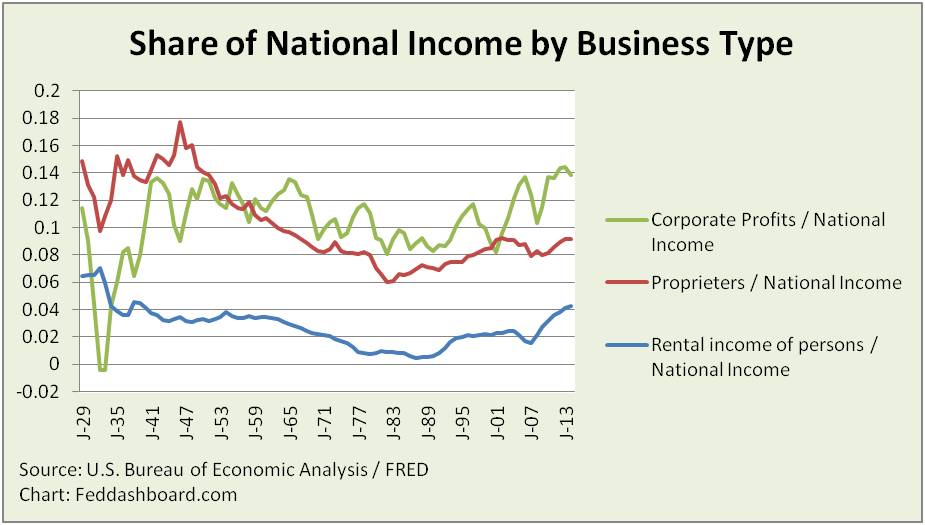
In National Income, 3 categories can be considered business – corporate profits, proprietor’s income and rental income of persons.
 In this national income approach, business was just over 25% of GDP in 2014.
When the business measures are added to compensation of employees, net interest and net government the total is GDP.
In earnings releases, net income – adjusted from financial to economic accounting – maps to corporate profits in economic releases.
While profit is one data point, the most important data for “actual alpha” fundamental investors is about what is scarce. Today, revenue is rare. Where is that view?
Value Added
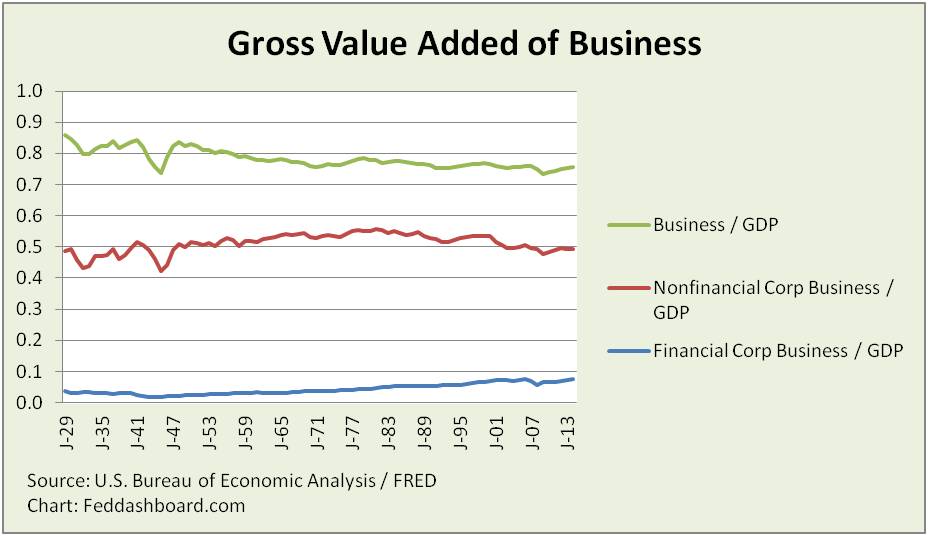
Value added approach has 3 sectors – business, households and nonprofit institutions serving households, and government. Value added is output minus intermediate inputs. At the overall economy level where intermediate inputs cancel out across companies, value added is roughly sales plus net inventory increase.
 In this value added approach, business was just over 75% of GDP in 2014. In the picture, the green “business” line includes both types of corporate businesses plus private businesses.
The value added measure is often used in other countries. This is why reading economic releases in other countries seems different from U.S. releases.
When the business measure is added to household and nonprofit, and government value added the total is GDP.
In earnings releases, sales – adjusted from financial to economic accounting and for change in inventory – maps to value added in economic releases.
Investor Insight
Value added is especially important because:
- It is the fundamental “ring the register” measure of business health
- It is used to find opportunities in industries
- It is what is most rare today, as opposed to the dot com bubble 15+ years ago when profits were more rare
Dividing market value of equities by business value added is a measure of the strain between the financial equity market, and the tangible goods and services market. If the Strain Gauge is historically high without a historically optimistic view of the next few years, then it is a warning that financial markets are overpriced.
