
4 September 2014
Confusion in corporate cash continues. Previously, we clarified who holds cash. This note is on cash compared to fixed investment – digging deeper than averages, some industries and companies are healthier than others.
At the height of the 2012 London Olympics, we began a series of NYSE floor commentaries describing how most cash is in relatively few corporations. One summary was 34 Corporate Olympians in 2Q2013 Earnings Season. In April 2013, the WSJ quoted the insight that 50% of SP500 cash was held by only 22 companies.
Today, 3 more insights…
1. Corporate to household cash ratio has been rising since 1969. Post-dot com bubble corporate cash proportion has been generally falling, but still above pre-bubble levels.
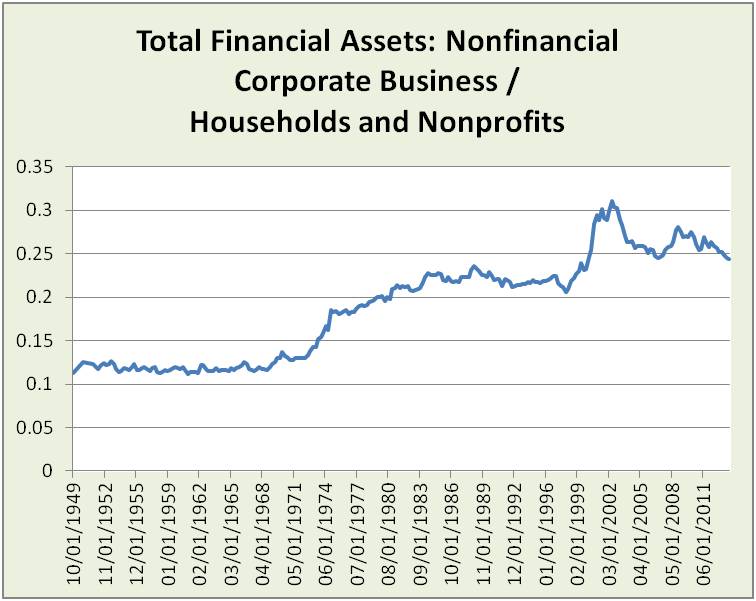 Source: US Federal Reserve System, Financial Accounts, Z-1 Release
2. Fixed investment relative to corporate cash has been generally shrinking since 1982, both in a balance sheet view…
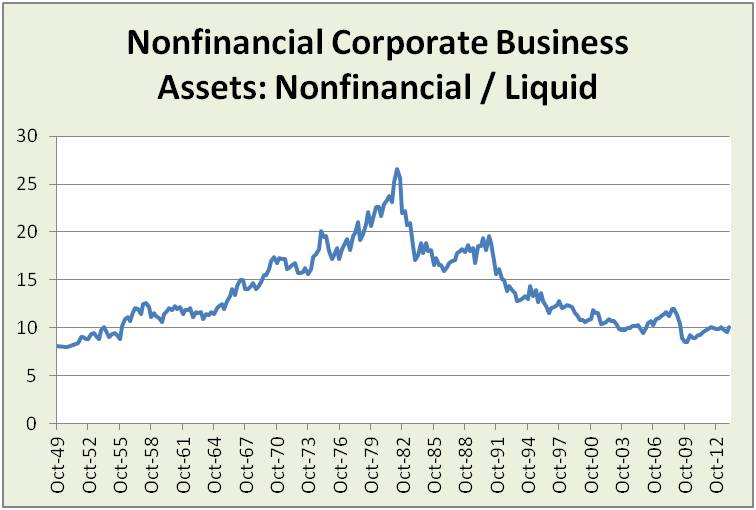 Source: US Federal Reserve System, Financial Accounts, Z-1 Release
… and a cash flow view, with a post-crash attempt to upturn. 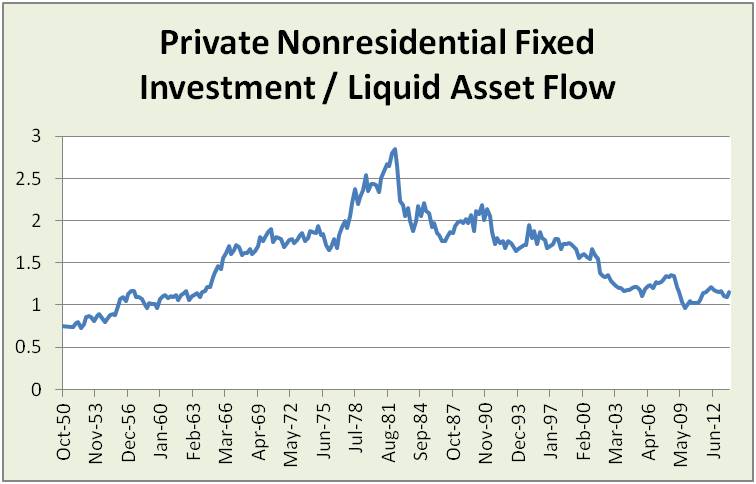 Source: US Federal Reserve System and US Bureau of Economic Analysis
This 1982 pivot is associated with a wave of factory automation and globalization.
Yet, the stronger effect seems to be financial. Liquid assets compared to gross value added of nonfinancial corporate business rose from 1982 to 1986, dipped and then grew again beginning 1990. This may well reflect historically high real interest rates beginning in 1979, new financial products of the mid 1980s and faster growth of those products until the recent bubble burst.
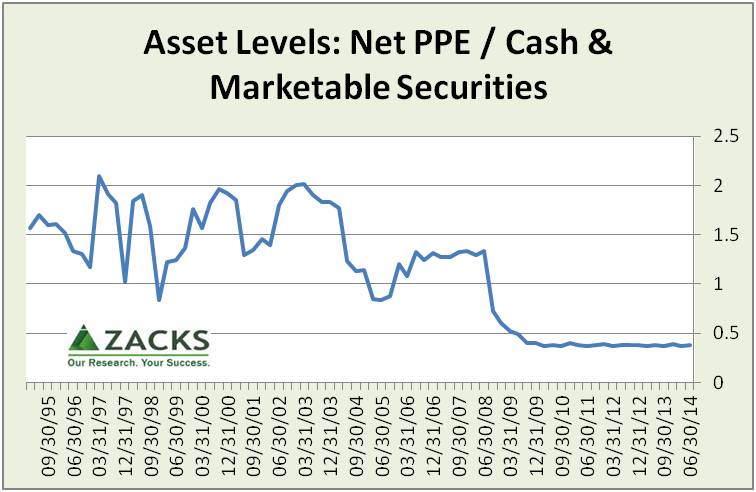
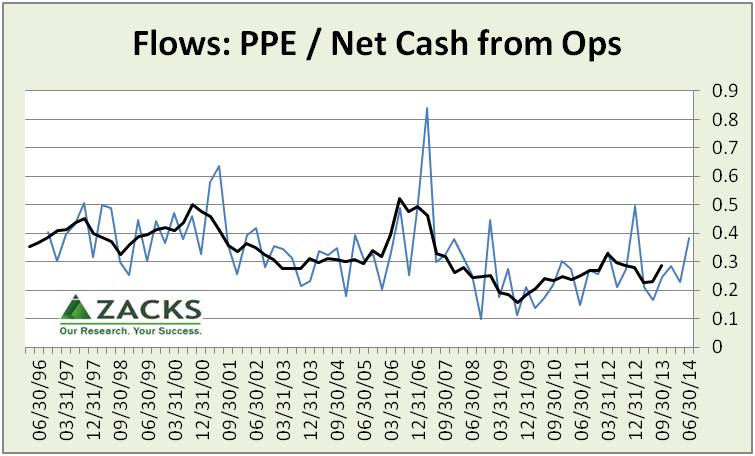
3. Public company balance sheet shift was a seismic fault line in 2008-9 as illustrated by the Zacks Research System composite ETF of the Russell 3000 Index.
 Notes:
- “PPE” is “Property, Plant and Equipment” – above, it is the balance sheet LEVEL; below, it is the quarterly CHANGE in balance sheet and also cash FLOW statement amount.
- Russell 3000 is intended to cover 98% of public companies, including financial
- Zacks Research System provides a unique, bottoms-up view based on SEC filings
The cash flow view pictures a struggle to reclaim 1996-2006 levels (black line is a 4 period moving average of quarterly data).
 Comparing cash levels to sales shows a similar fault line – cash up nearly 4x pre-crash levels.
 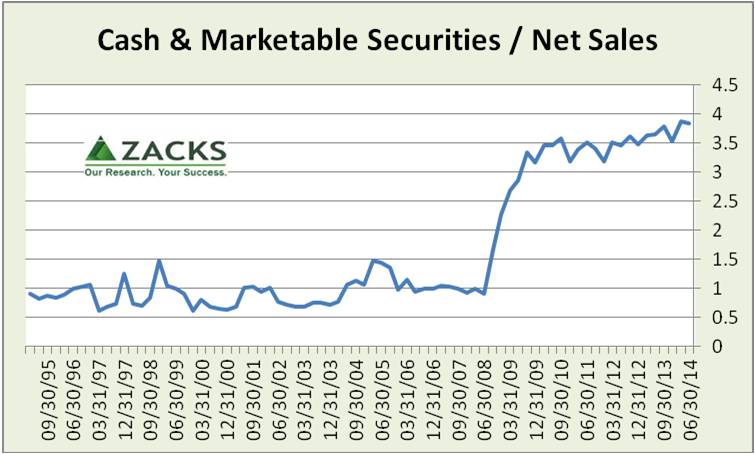 Differences between the broad economic and SEC data-based Zacks views reflect differences in: economic versus GAAP accounting, public verses private companies, methodology and data quality in broad economic estimates versus scrutinized SEC filings. Yet, these differences matter to decision-makers.
In seeking explanations within the SEC-based data:
- This picture is the opposite of cash efficiency and it is not hidden unaffiliated investment portfolios because securities have been decreasing relative to cash.
- This might be more than caution. “Cash haves” announce growing cash for engineering earnings per share (EPS), acquisitions when struggling for organic sales or to achieve loftier strategic goals.
- New factors include the rise of trade credit to fill the gap in bank financing, as we shared in Big Firms Fill Funding Gap from the WSJ.
At the sector level, data reveal differences. For example:
Zacks Consumer Staples composite fluctuates more than others. 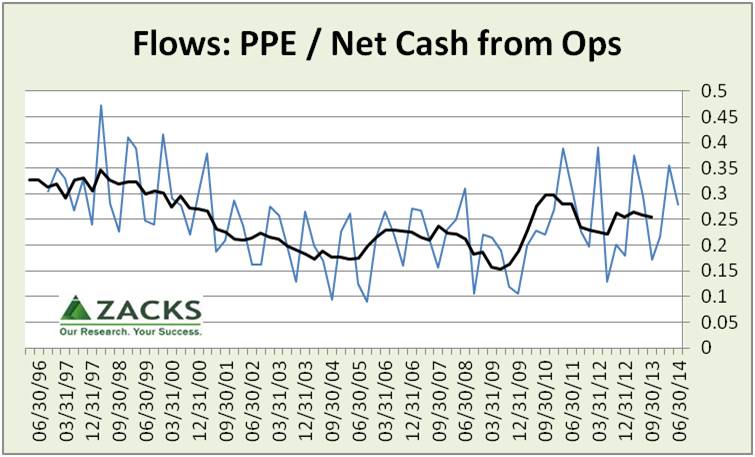 Zacks Medical composite shows a pivot in 3Q2010.
 Note: Extreme negative in 1Q2010 removed to show detail in other data points.
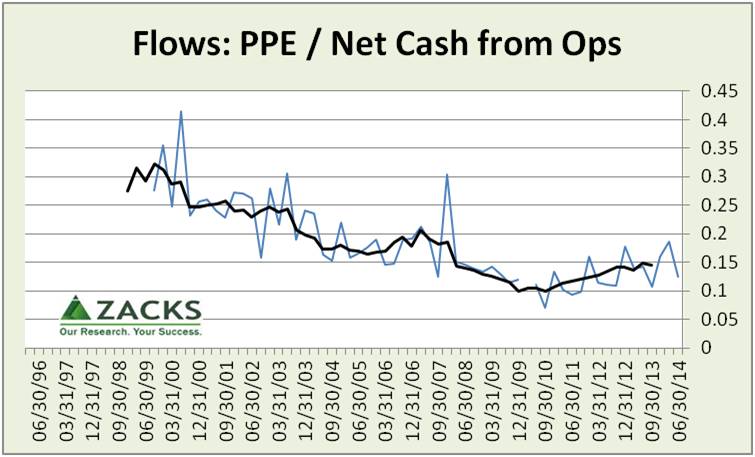
Zacks Oil and Gas composite is on an uptrend, resumed after a 2009-10 dip. 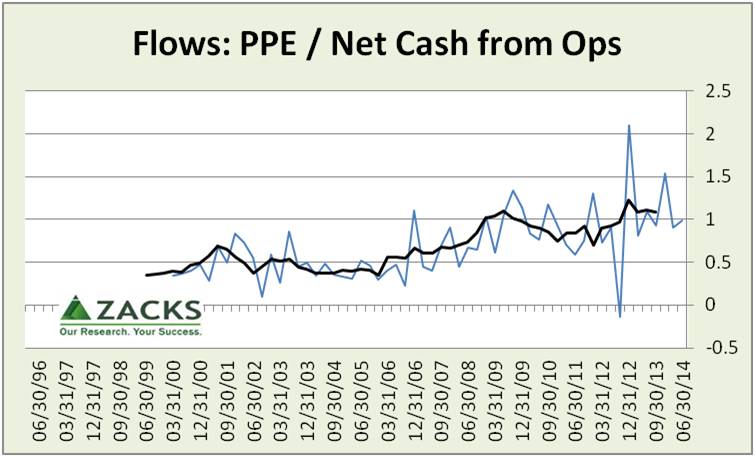 Because of sector and company differences, more than a simple ratio is needed to filter for companies creating more value.
At the company level, growth in PPE/Operating cash flow ratio can be a filter to then evaluate companies for funding:
- PPE to grow capacity, not just maintenance
- Technology for growth versus cost-cutting:
- Technology that enables more innovative cars is very different from technology that automates car part assembly.
- Test whether technology is mostly: 1) leading to more jobs, enabling people to innovate in new products and growing organic revenue, OR 2) just automating tasks, dumbing-down jobs and firing people. Importantly, fluctuations can be good, reflecting cycles of teching-up followed by skilling-up people, then back to tech. Cause matters.
- PPE to enable a more differentiated and defensible competitive position
In this way, digging beyond the economic averages into business models provides insight for investors and policy-makers into “what good looks like,” including jobs, tax and regulatory policy.
In summary:
- Averages hide valuable insight
- For all public companies, while cash is growing, bigger stories are about changes in fixed investment and trade credit
- For policy-makers, emphasis is on fixing policy side-effects that drag on investment
- For investors, emphasis is on buying businesses, not just market averages