
13 September 2014
Mixed economic headlines miss the point of an underlying negative feedback cycle that includes difficulties in debt, wages and business sales.
Debt Level View
Debt level continues to overhang consumers. In 1982 debt rocketed up from the historical trend, dipped from 1995 to 2002 and continued to climb until 2009. While real debt per person is now declining, the level is still higher than any time before 2006. 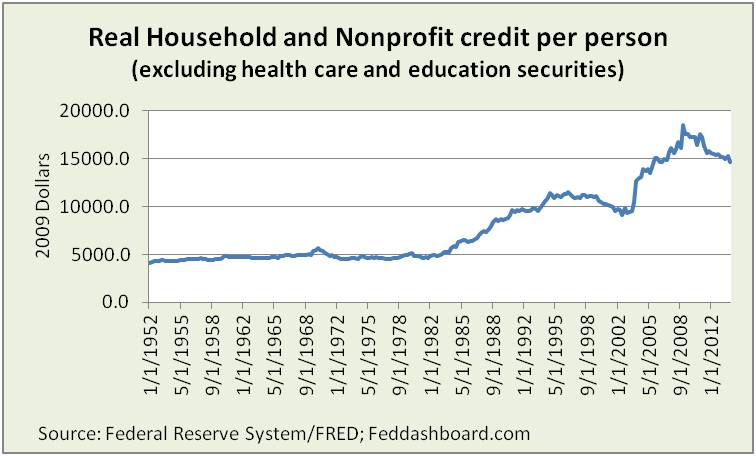 Notes:
- To compare over decades, adjusted for both inflation (using Personal Consumption Expenditures deflator, PCED) and total population.
- Federal Reserve reporting combines Households and Nonprofits. To provide a view closer to consumers, this view excludes securities issued by health care and education nonprofits.
Debt level more fully pictures debt burden in contrast to debt service that appears less painful. Why? Because the debt service view can decrease simply by lengthening debt repayment schedules.
How much debt drops is some combination of reduced spending and saving, cancellation, and increased wages and salaries.
Wallet View – money in, money out
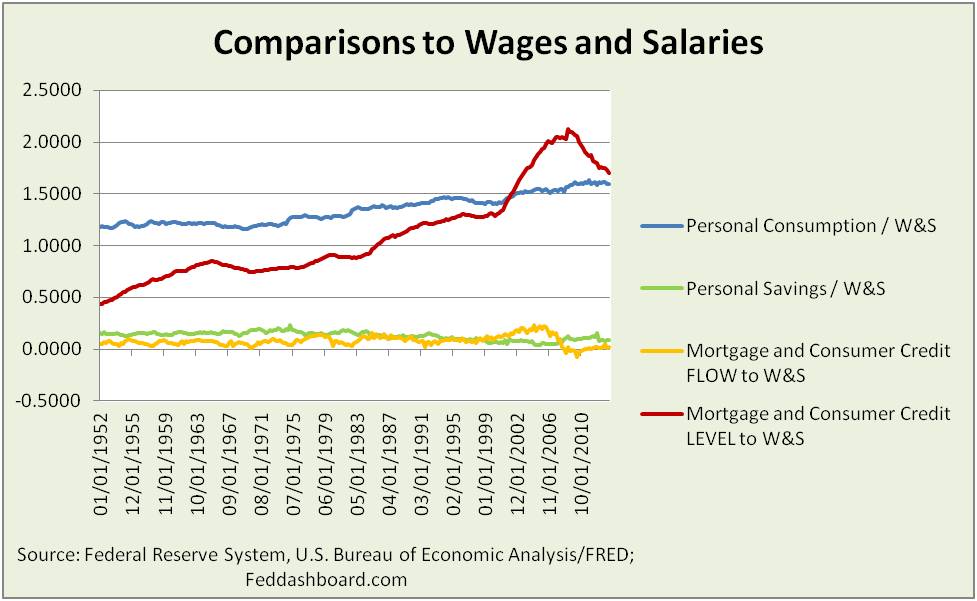
This picture compares debt, savings and spending to wages and salaries.
Good news:
- Since 2009 the mortgage and consumer debt level has been falling compared to wages and salaries
- In 2008 new credit flow turned lower than savings, as it was prior to 1982
Caution:
- Savings is lower than pre-1995 levels. This is especially troubling as baby boomers are in peak earning and saving years.
- Consumption at historical highs is good for business sales, but not for household finances.
 Note: Consumption, savings and debt service can also come from government transfer payments, insurance payments, use of past savings and other income (e.g., investment, rental property or proprietors). Wages and salaries are the focus here as a reflection of core health.
In short, the wallet view is cautiously optimistic on debt levels, but significant work is needed to improve savings and constrain consumption to avoid more debt and/or strain retirements. Bad news:
- Constrained consumption brings reduced business sales
- Stimulus monetary policy of lower interest rates on new debt is less effective in the face of higher interest rates on existing debt – especially when the middle class is trapped by insufficient income quality to commercially refinance a mortgage but too much equity to qualify for government-sponsored refinancing – draining wages and salaries for debt service.
Two Stories in Wages and Salaries
Striking is that growth in real wages and salaries is relatively healthy – IF only employed persons are considered. Employed persons fared better after the most recent bubble burst than in past drops. It is more striking to realize that if workers with few hours were removed from the Employed count, this ratio would look better.
The struggle comes when wages are spread over the entire population. While employees may go away, mouths to feed stay.
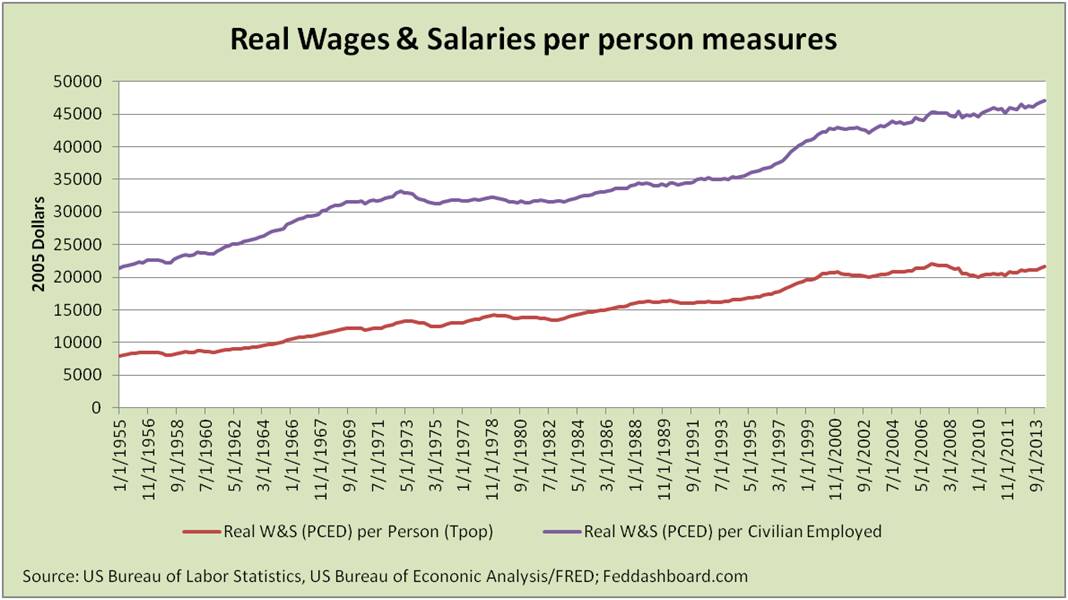
This helps explain why employers feel payrolls are high and continue to cut, while the broader population feels pain. In these averages, a glimpse is seen of two labor markets.
This insight strikes close to the core.
- Downward pressure on wages and salaries (and hours worked) puts downward pressure on business sales. While growing exports can help, this is dependent on the health of other economies, and tax and trade law.
- Catalysts of confidence are essential to break this negative feedback cycle.
At the individual worker and company level, a split in the labor market is also seen when wages offered are not high enough to cover a person’s cost of working – transportation, child-care, clothing, food and related sales, personal property and income taxes. Thus, while counts of job openings look promising, two different wage needs leave jobs unfilled.
In summary, job counts and interest rates top headlines.
- Yet, debt, and wages and sales in a negative feedback cycle seem far more structural.
- Fixing these causes requires more than monetary policy. Government, business and consumers must each play their role to foster catalysts of confidence.