31 December 2014
Quick, what’s the world’s second largest economy after the U.S. at USD 16.8T?
Euro at USD 13.1T, by region. China at USD 9.2T, by nation. Or, the S&P 500® members at about USD 10T. S&P 500 members are U.S.-based and have just over 46% of revenue produced and sold outside the U.S. according to the S&P Dow Jones 2013 Global Sales report. For comparison, Japan is the third largest country, just under USD 5T.
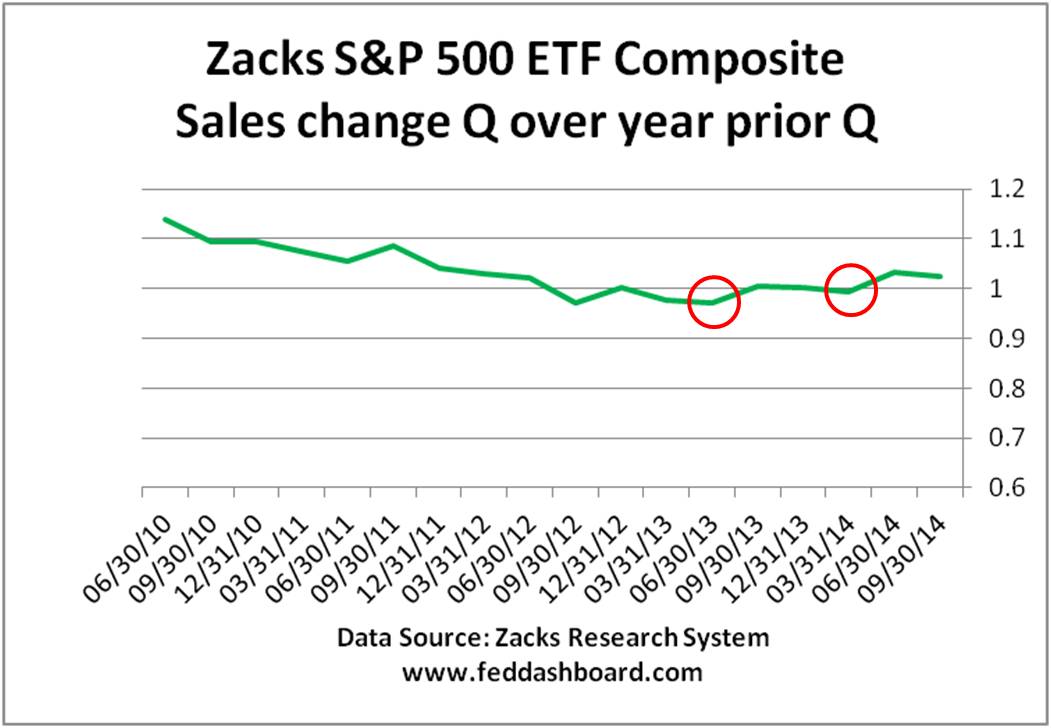
Analyzing these companies as an economy provides powerful insight. The Zacks Investment Service S&P 500 ETF composite makes this data available and Zacks Research System makes it easier to analyze. What has been troubling to fundamental investment analysts for several years is “top line” sales weakness. From 3Q2014 data, a growth trend is now clearer.
The upturn started one year ago. Yet, the next two quarters, struggled to stay ahead of inflation. Then, the two recent quarters were clearly ahead of inflation – economists like two quarters to make a trend, so time to cheer.
 Just like country GDP, there are qualifications to equity index composites. First, index members come and go. Zacks’ composites control for member changes. Second, index combined revenue grows when members acquire nonmembers and shrinks when divesting. On net, there is still some lift from healthier companies surviving and acquiring. Thus, extra growth is desired in composites and company specifics are important.
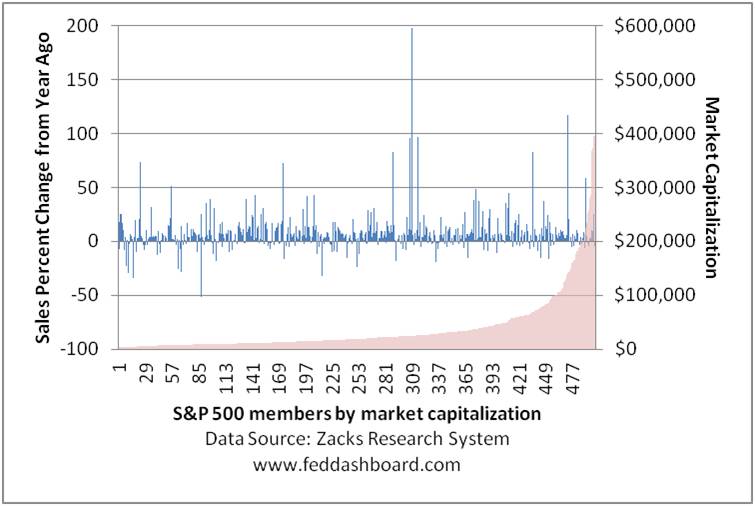
Looking at individual companies with Zacks Research System we can see sales change by market capitalization.
 Nearly 70% of companies had real (inflation adjusted) sales growth in 3Q2014, up from nearly 66% in 1Q2014 – this is more good news, especially to the extent that sales were organic. Still, investors are concerned that 30% of board members and CEOs are sailing ships that are unintentional sales submarines.
Silver Lining for Fundamental Investors
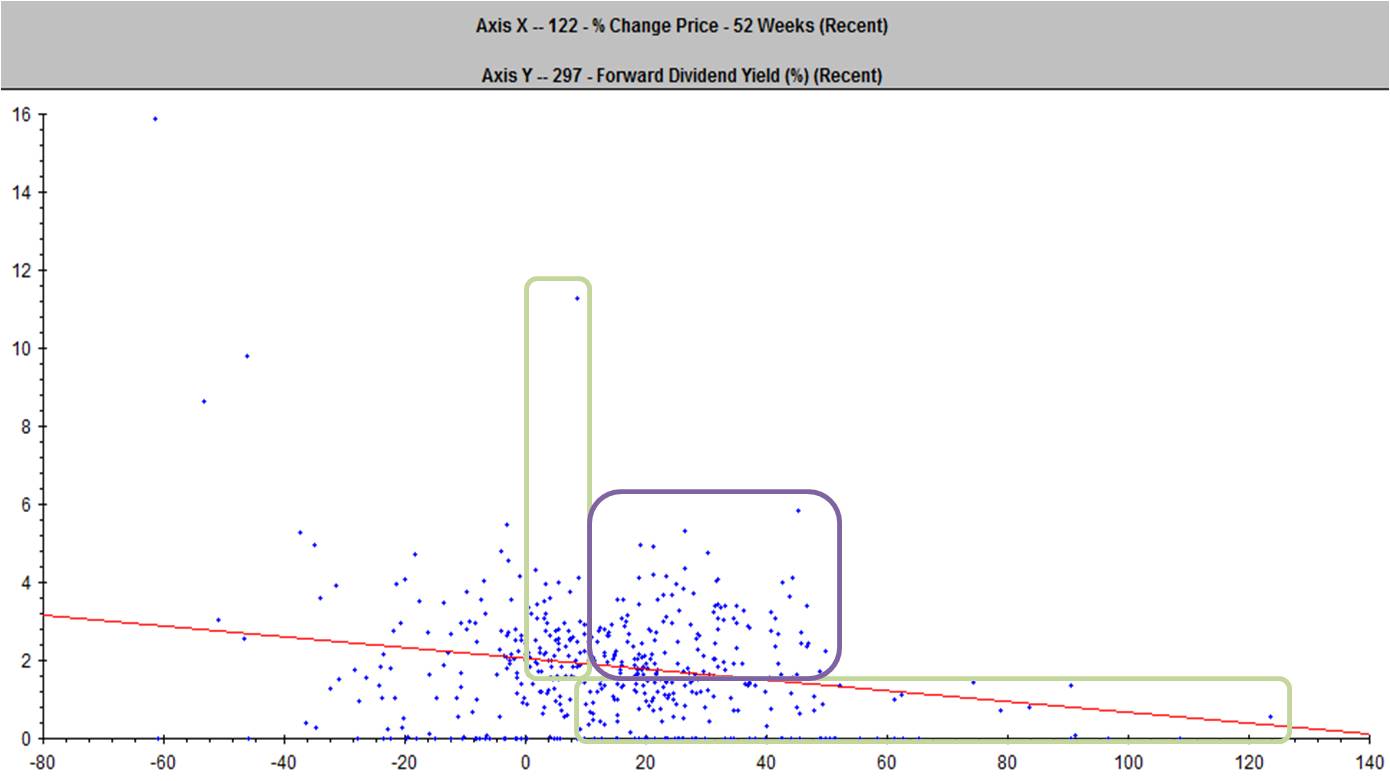
Sharp contrasts between companies who know how to grow sales versus just engineer earnings provide opportunities for fundamental investors. Still, for pension funds, endowments or individual investors, sales must translate into share price appreciation or dividends. Remember, public company investors don’t get earnings, much less earnings per share. As different investors have different preferences for price appreciation and dividends, Zacks Research System scatter plots illuminate.
 The green boxes show those companies paying greater than the 1.9% average forward dividend (per Zacks) or with price appreciation greater than the S&P 500 index 52 week performance of 13.6%. The purple box companies have a mix because the board and CEO have EITHER: a clearly-defined balanced strategy OR confusion in objectives – investors need to determine which. Of course, some of the ugly ducklings have a turnaround story in the making.
Investor Insight
- There are starter buckets investors can use to apply a business model-based investment strategy. How far an investor then digs into fundamentals is where extra reward is mined.
- For investors eager to search for reward, tools like Zacks are uncovering mispricings. Interestingly, fundamental investors are wondering if mispricings are becoming more prevalent and persistent because of index and beta funds. Because beta funds look more at market data than company fundamentals, they may be missing opportunities. So-called “smart” beta funds are starting to use methods like those above to throw out a few bad apples from an index fund. A hot topic in fund design is how many bad apples will be thrown out and the extent to which the criteria will include deeper fundamentals.
For the New Year, the question is, “Will 2015 herald a renaissance in ‘actual alpha’ fundamental investing?”

