
15 January 2015
To understand the big oil big story, have you seen the big data?
Prices and inventories typically make headlines, but deeper data trends on consumption and production give investors foresight.
Consumption
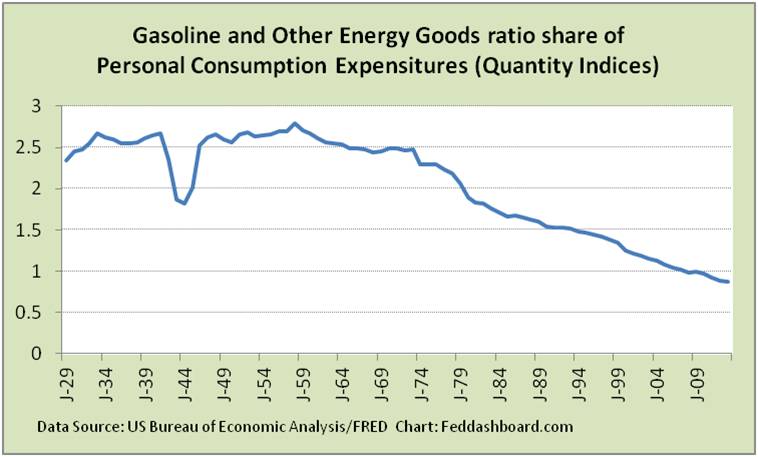
In consumption, oil and gas prices reflect global demand from consumers, business and government. Typical charts look at quantity or dollar purchases. However, this hides inflation, population and economic activity. To reveal hidden trends, we can focus on one segment such as US personal consumption. To look back over 85 years, we normalize for population and economic activity. Thus, this picture compares purchases of Gasoline and Energy Goods to all Personal Consumption Expenditures.
This reveals a steady consumption decline since 1958. This decline is one element of today’s perfect storm.
 Production
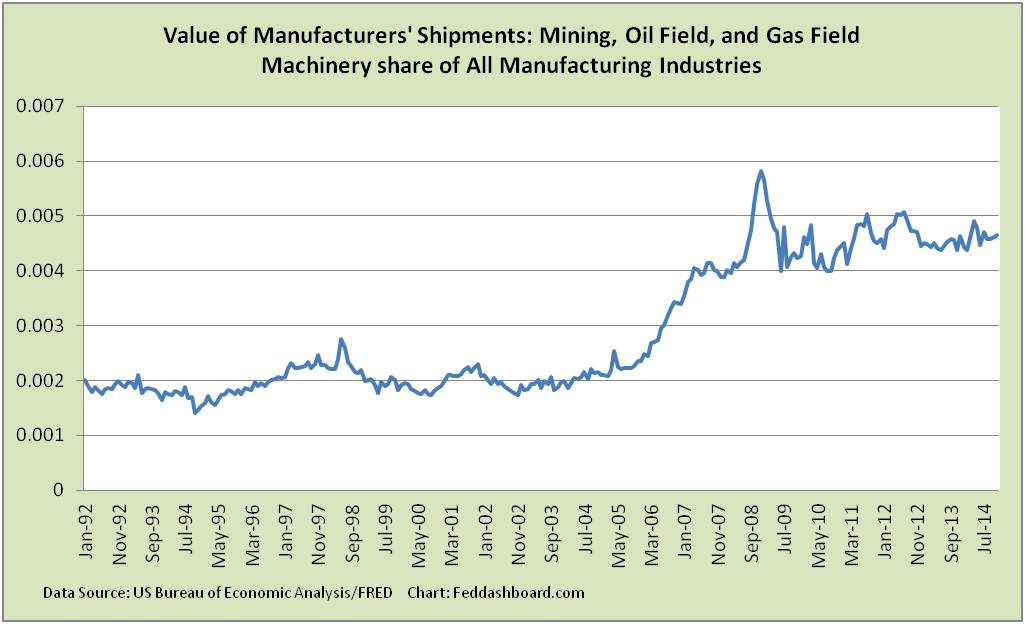
Switching to the production view, we can see the growth of investment in machinery for mining, oil and gas extraction. So the picture over 20+ years isn’t distorted by inflation or general manufacturing activity, this is picture shows machinery shipments for extraction compared to all machinery shipments.
 Production also requires more workers. This opportunity is drawing workers from “back east” states like Connecticut to “go west.” To look at job counts in oil and gas alone would be a mistake; this would hide broader changes in the workforce over the past 40 years. This picture is of oil and gas extraction workers relative to all civilian employees.
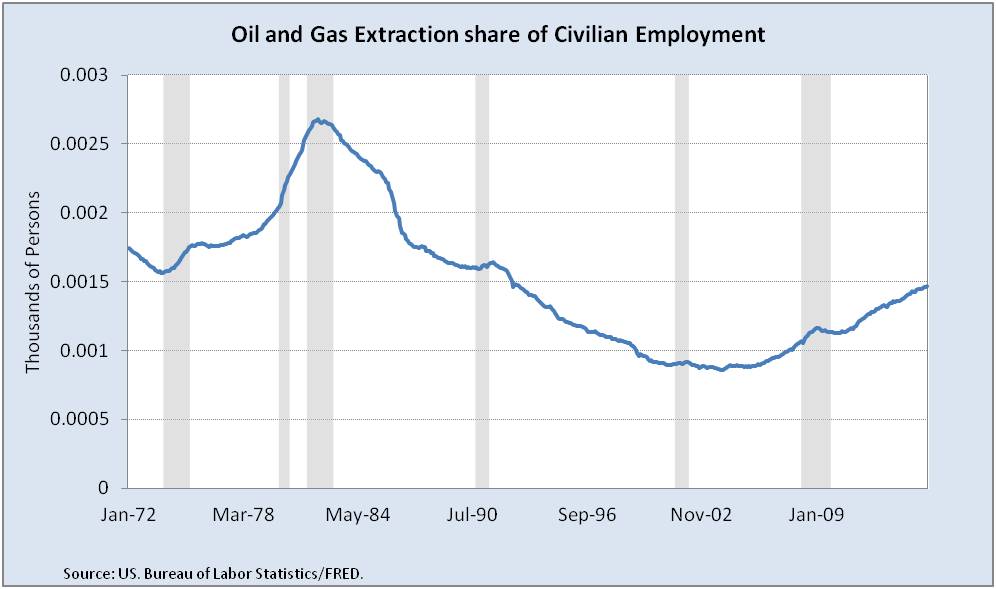 In earlier phases of oil and gas field growth, workers are more heavily used relative to machinery simply because people are setting up machinery and are more flexible. For this reason, labor productivity has dropped. However, as fields move into normal operations mode, we would expect to see rising productivity and lower growth in employment. This has nontrivial implications for production costs.
 Where are these jobs? The US Bureau of Labor Statistics (BLS) provides a county-level view.
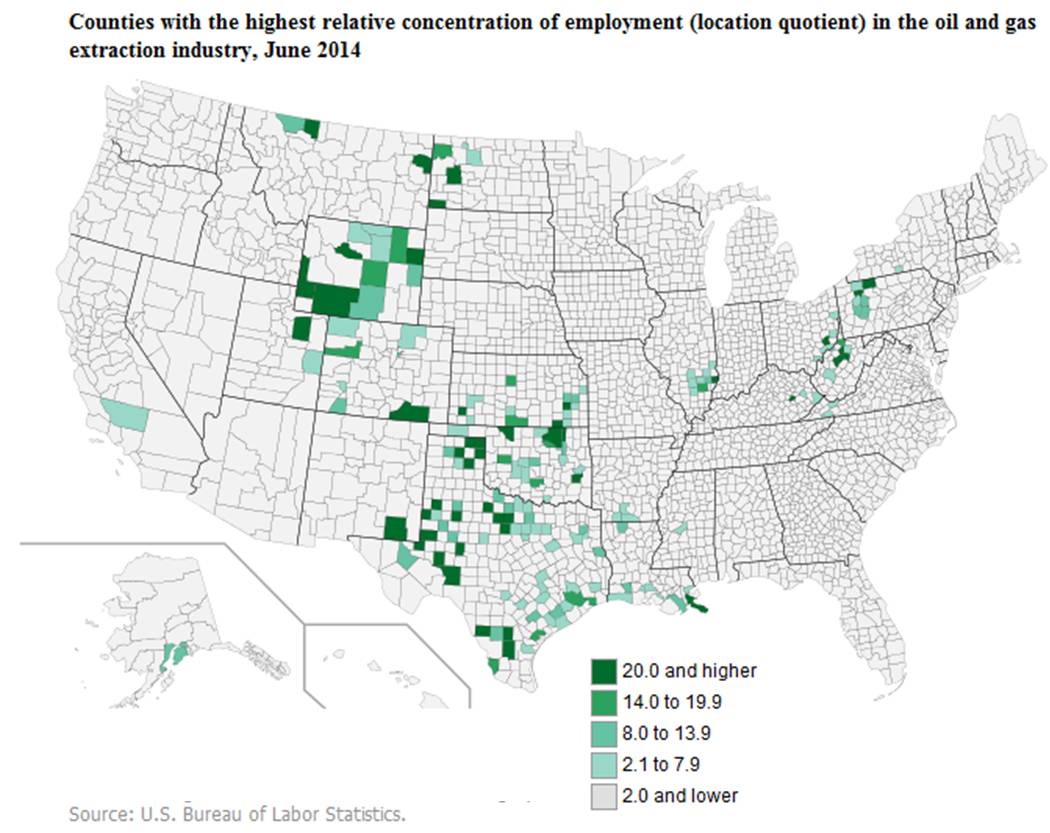 An interactive version of this map is at the BLS website. This map pinpoints economic growth more precisely than the geological maps from the U.S. Energy Information Administration.
These pictures are just a tiny fraction of data available to inform policy and investment decisions.
Investor Insight
As often the case at Feddashboard.com, this illustrates:
- Right data gives an early view to investment opportunities – both extraction and machinery for extraction
- Field phase of production and location are inputs to finding investment opportunities with business model-investing
- Analyzing these details along with broader data provides an information edge for investors willing to dig into data