
30 December 2014
Big 5% jump in U.S. Real Gross Domestic Product (GDP) is reason to cheer. In any quarter, the cause of change matters.
In a mystery, a crime detective wants to know a suspect’s means, motive and opportunity—three questions that bring a bounty of useful data. Applying such Sherlockian skills of analysis, you too can be a GDP detective by asking 3 questions.
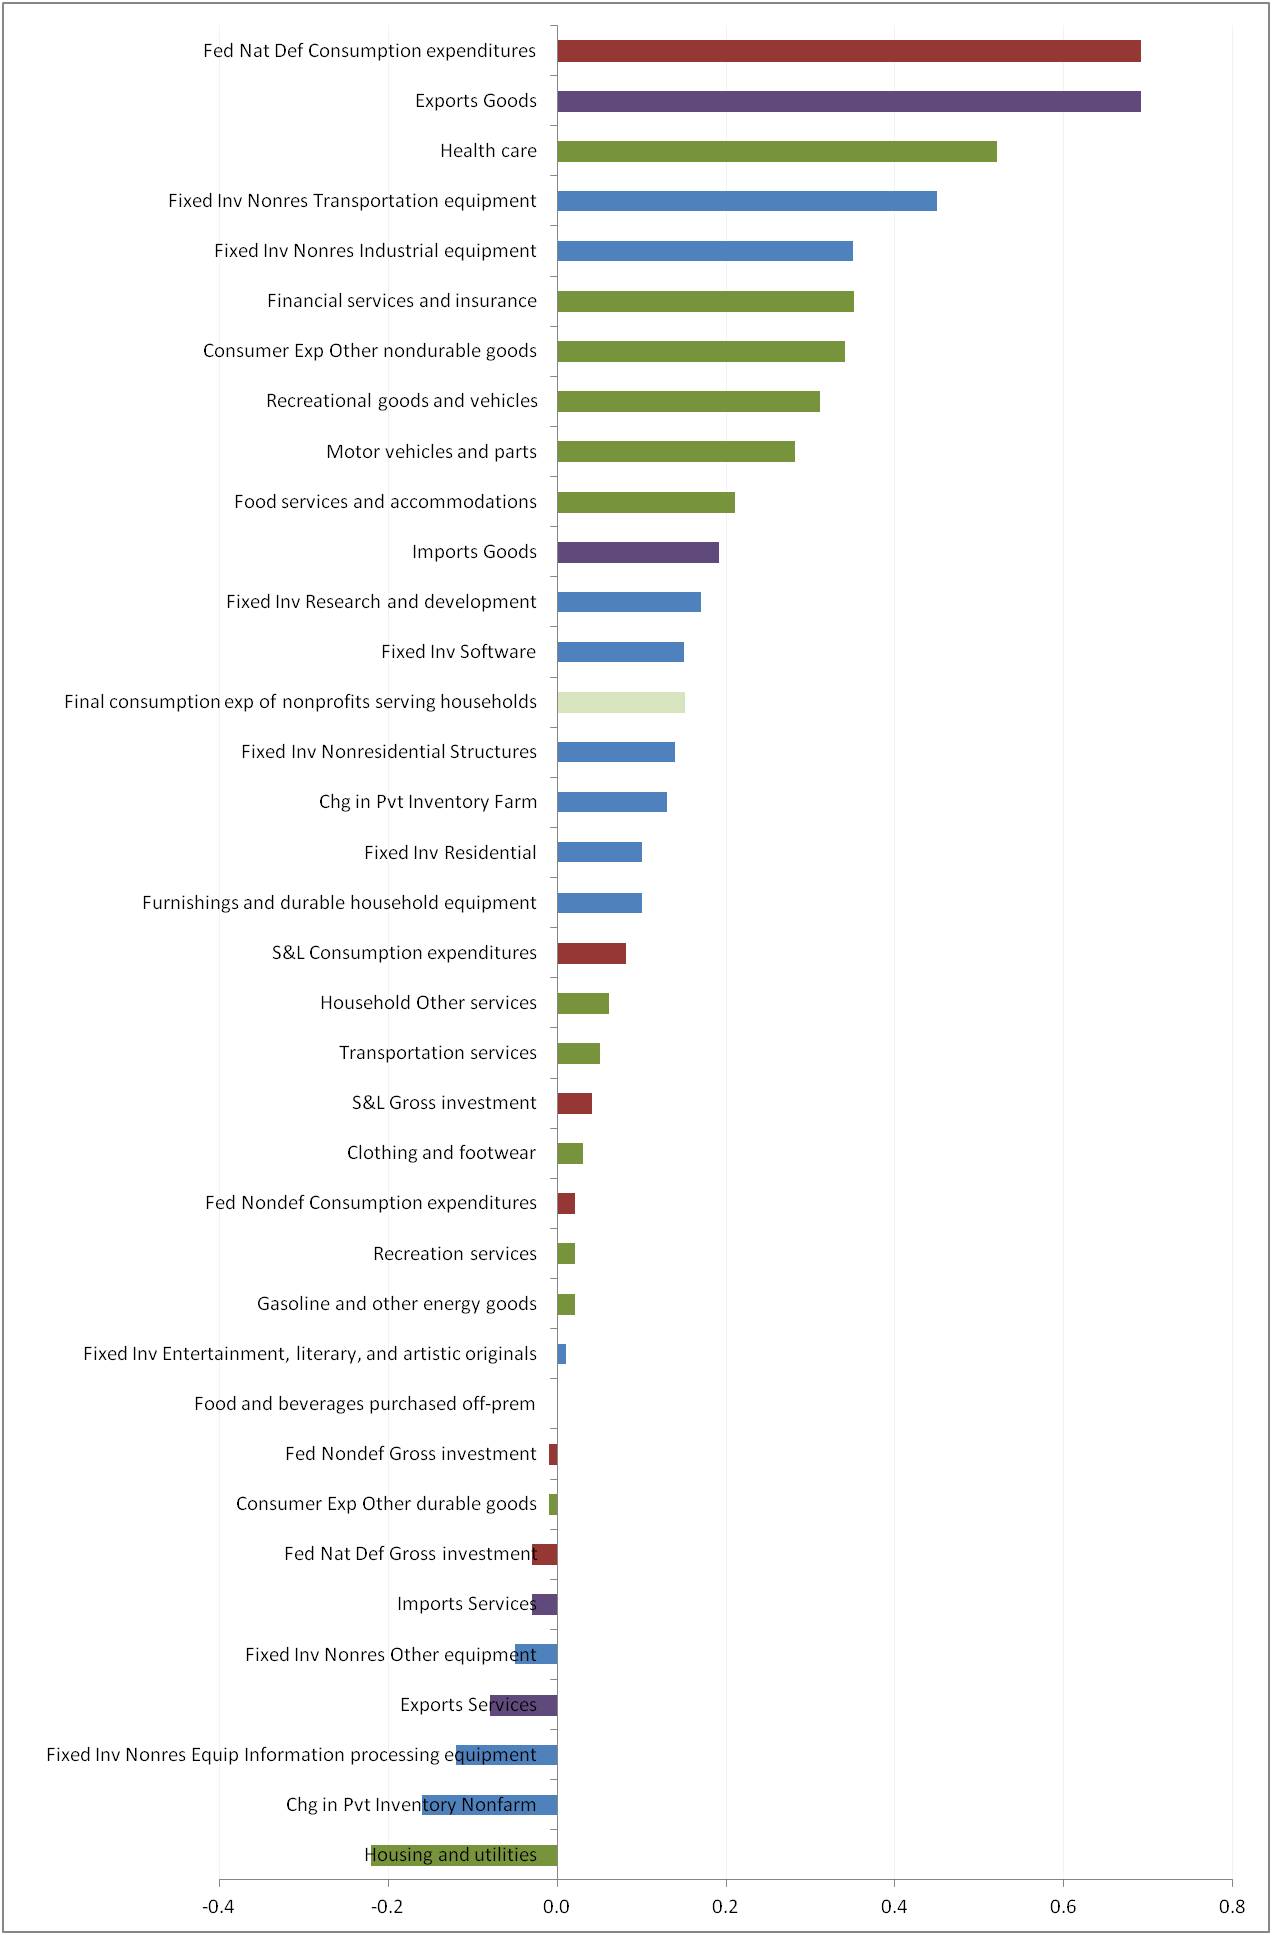
Question 1: “What is really growing?” To answer, start with the U.S. Bureau of Economic Analysis’ (BEA) Table 1.5.2. Contributions to Percent Change in Real Gross Domestic Product, Expanded Detail. These numbers detail how the growth and size of each category combine into the total GDP change. To picture this data more easily, a color-coded chart helps: red for government, purple for foreign trade, green for consumer, light green for nonprofits serving households and blue for business.
 Question 2: “What shows consumer and business confidence?”
The answer means screening out:
- Government spending as it is not driven by private evaluation of the economy. In early days of National Income and Product Accounting, there was a debate about whether the government sector should be included at all. The value of including or excluding depends on the question being asked.
- Exports as they are driven by buyers in other countries – yet, exports are excellent.
- Health care and aspects of financial services as they are less discretionary.
What remains are the more helpful signals of confidence. In 3Q2014, the strongest contributors are business Transportation and Industrial equipment, Software, and Research and Development. For consumers, strongest are Other Nondurables, Recreational goods and vehicles, Motor vehicles and parts, and Food services and accommodations. Other than forced replacements, these are solid signs of confidence. Good news.
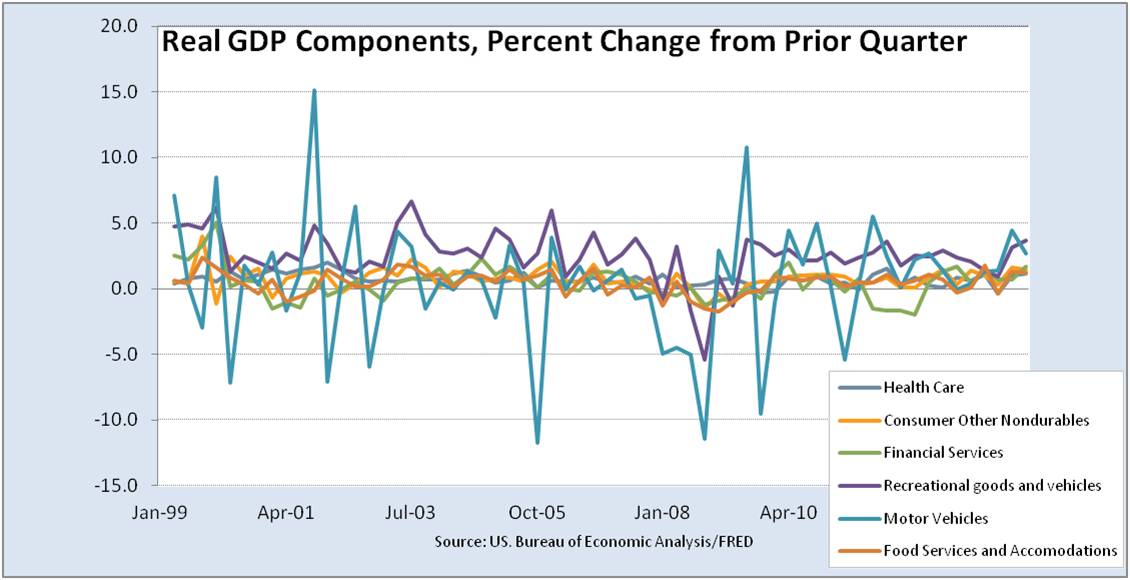
Question 3: “What is the trend and stability of this growth?”
An answer lies in BEA Table 1.5.1 Percent Change From Preceding Period in Real Gross Domestic Product, Expanded Detail.
Even with volatility, Consumer other nondurables, and Recreational goods and vehicles have not had a negative growth quarter since 2Q2009. Motor vehicles and parts have not had a negative growth quarter since 2Q2011. Good runs for both.
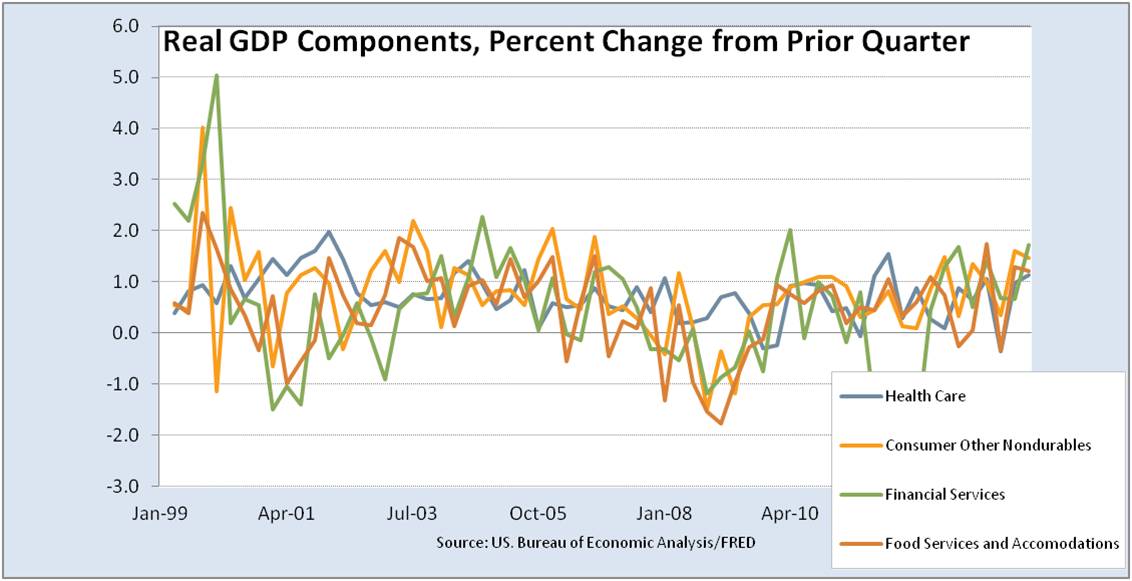
 To picture this more clearly, the more volatile Motor vehicles and parts, and Recreational goods and vehicles categories can be removed. This picture reflects a gradual upward trend since late 2009 with varying volatility in each category.
 On business spending, Equipment is more volatile than Software and R&D. Good news, Equipment hasn’t had a negative growth quarter since 3Q2012, R&D not since 3Q2013 and Software not since 2Q2013. Industrial equipment has had strong 6+% growth two quarters in a row — very good news.
 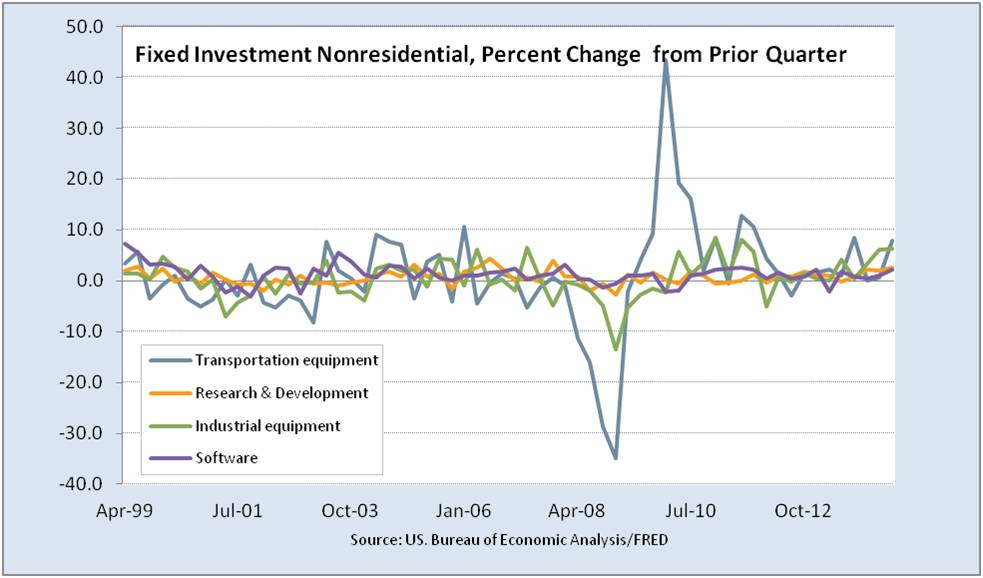 A GDP detective can ask these same investigative questions of the weaker GDP categories as well, to find fundamentals indicating a potential rebound.
Investor Insight
This data can help: avoid churn from quarterly GDP swings and spot sector investment opportunities.
Forward-thinking detectives (investors) can peek ahead at likely quarterly estimates by looking at monthly estimates used in the quarterly estimates. This is sport for economists who support financial market traders. For more see GDP Estimate Revision – who knew what when?, July 2014
Happy detecting in the New Year.