
Strain between financial markets and corporate output is over 12% higher than at the peak of the credit bubble. With strain this severe, it’s vital to know why – starting with monetary policy and business sales.
Baron’s Bargain Busts
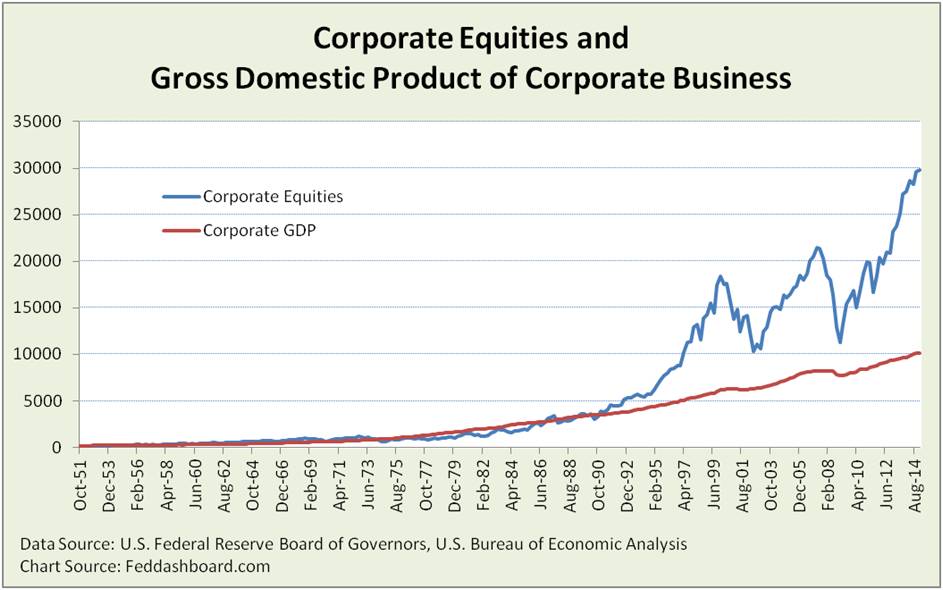
Imagine you were a business baron in 1951 and paid a royal sum to buy stock equal to 1% of U.S. corporate output (GDP). Would that same sum give you 1% of corporate GDP today? No.
You would have 70% less, only 0.3% of corporate output.
Why so much less? Because equity prices grew so much faster than corporate output (sales + inventory).
 Stock prices and GDP each make headlines, but not the two together. This is a gap.
Strain Gauge
To close the gap, the Strain Gauge measures the strain of corporate equities (public and closely held) above the value of tangible goods and services (corporate output).
Corporate output is also corporate value added in our economy and contribution to GDP.
Today, the Strain Gauge seems the most helpful market valuation measure of those discussed in this Bloomberg Brief.
Using the recently released third estimate of 1Q2015 GDP, the Strain Gauge is more than 12% higher than the credit bubble peak and within 2% of the dot com bubble peak.
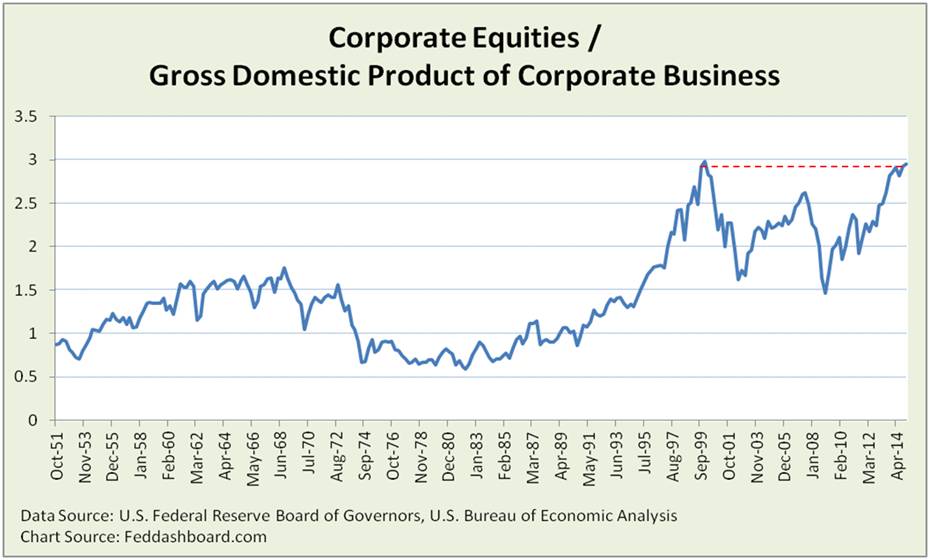 What was happening in the mid-1990s when strain hit new highs?
- Baby boomers were 30-50 years old
- New growth in checking and savings account balances
- Entered the Treacherous Triangle of the housing and credit bubble
- Second stage of the stock rally ignited on its way to the dot com crash
Did the dot com crash reconnect the financial asset and tangible product markets? No.
Instead, strain grew into the credit bubble.
Today’s lofty heights are scary, what is keeping prices propped up?
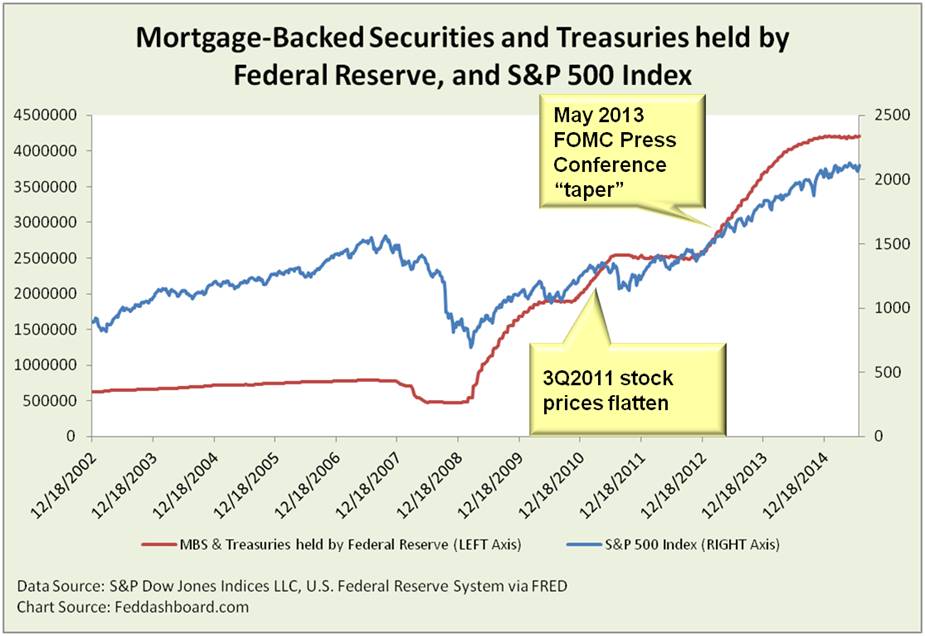
- Monetary policy
- Extraordinary monetary policy? Don’t fight the Fed. Fed action has been overwhelming as pictured in the chart below.
- Lower interest rates?
- Maybe so — Market analysts favor this explanation because of the view that lower interest rates support higher Price/Earnings ratios because companies have lower borrowing cost, required equity returns are lower, earnings are less inflated or other reasons.
- Maybe not — Analyst projections have been notoriously off, academic research suggests low association between interest rates and investment, and business people seem to be more concerned about stability, their premium to real risk-free rates or specifics of a new initiative.
- Fundamentals
- Faster growth in corporate sales is THE need. Yet, average sales have been weak as discussed in “Avoiding sales submarines that submerge the S&P500.”
- Strong earnings growth is a popular answer.
- Earnings have been growing more than sales as companies cut cost.
- However, it will likely take sales growth to keep earnings growth sustainable. Why? Because too much earnings per share (EPS) growth has come from earnings engineering, and cost cutting into innovation and productive capacity.
- While earnings growth has been stronger than sales growth, it isn’t historically high enough to match historically high equity prices.
- Remember — EPS is a bit of a fiction. Public company investors get dividends, capital gains and price appreciation – not EPS. EPS matters because it is assumed earnings will be invested to drive sales. In the past few years, this hasn’t been happening.
- Keeping a lid on geopolitical and other price popping pressures as discussed in “Situation status and organic growth imperative.”
- Position protection – investors and traders with open positions have much to lose if prices fall. Trader psychology and algos can fuel the spark of panic. Offsetting financial positions and a collective conviction to avoid panic are key support to lofty valuations.
It’s easy to become complacent with modestly growing stock prices following tremendous growth. Yet, the strain is sky high. So watch for:
- Monetary policy carefully returning to normal
- Strong sales growth
- Geopolitical (military, social, health, disaster, economic) hot spots contained
Investor opportunity
- This discussion has just been about averages.
- Opportunity is in finding companies with less strain because of their superior business models.
Business leader opportunity
- To attract investors, especially longer term investors, give investors sales and free cash flow growth at a reasonable risk-adjusted return.