When trends collide, wreckage is measured in weak labor productivity. Longer term trends include 30 year old PIPE Factors and a 15 year old sideways move in hours worked. Post-credit crash trends include a hiring rebound, weak output growth and less investment in business buildings. Differences by industry and company create opportunities for business model investors.
Several paths help explain the productivity puzzle.
One path is about how companies shift between people and physical assets. Most striking is that companies are investing less in business buildings per hour worked. This increases the relative use of labor and decreases labor productivity. We explored this in “Read between the lines to solve the productivity mystery”.
Another is about patterns in data feed that labor productivity measurement (Output divided by Hours Worked) – our path here.
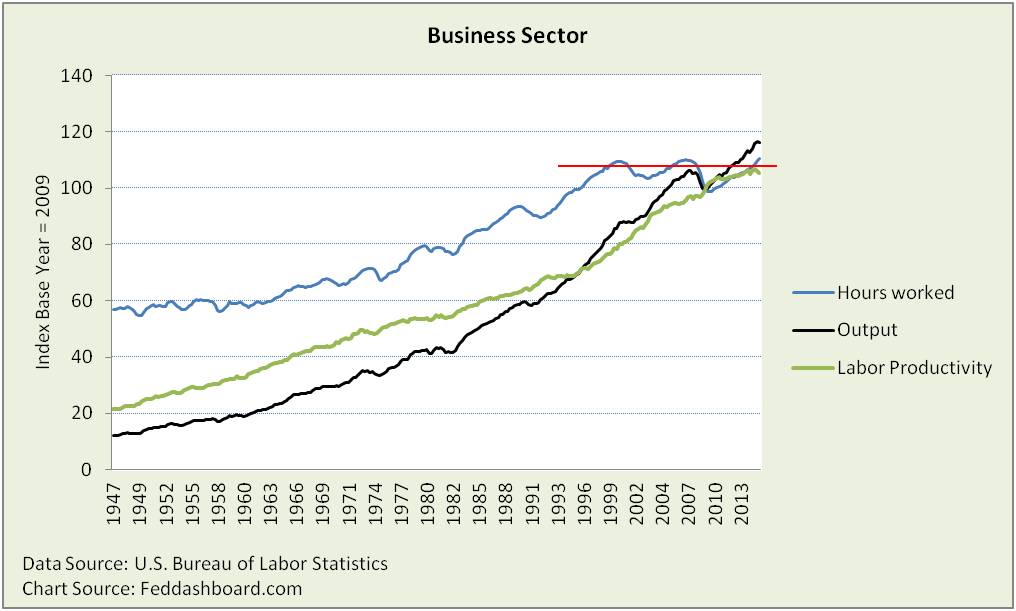
Higher productivity from 1999 to 2009 is mostly from Hours Worked breaking the historical growth trend and turning sideways.
 Much of this trend can be traced to imports as described in the story of the Red Dots and PIPE Factors. Another cause was the double-dip of the dot com crash and then 2001 that caused too many nonfinancial company leaders to become too risk averse.
Within the sideways move there are three peaks in Hours Worked. These appear differently in labor productivity because Output growth was very different.
- From the 2000 to 2007 peak, average output growth was 2.9%.
- From the 2007 peak to 1Q2015, average output growth was 55% less at only 1.3%.
Lower output means lower productivity.
Then what changed in hours worked?
Since 2009 hours worked grew faster than output, including a rebound from massive layoffs. More hours worked without more production reduces measured labor productivity. Going forward, exchange rates will loom large in how the rebound collides with the sideways trend.
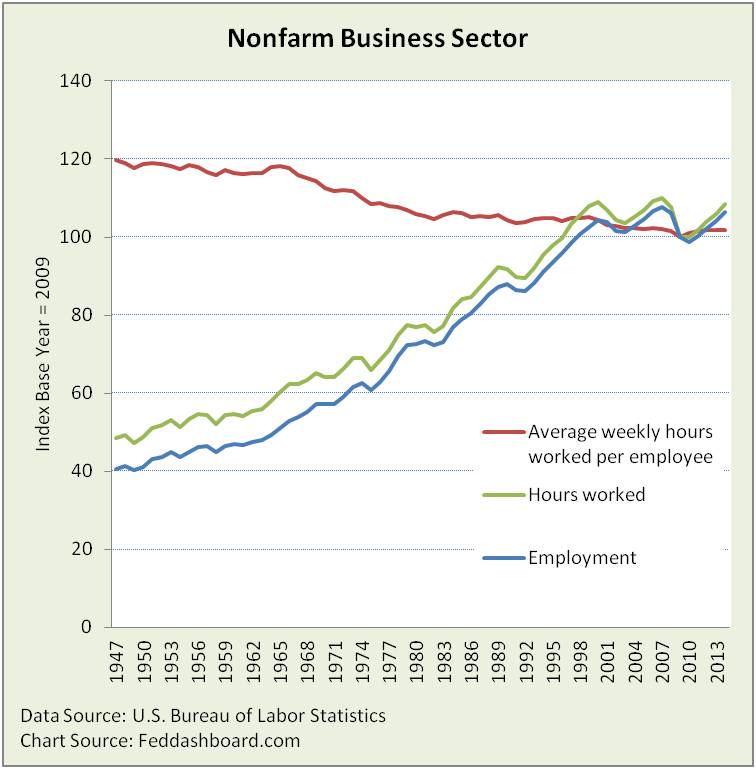
Hours Worked largely mirrors people employed.
 What’s important about employees and hours?
Average hours per worker (red line above) had been falling since at least 1965. In 2008 it flattened as growth in employment has nearly matched growth in hours worked. Why?
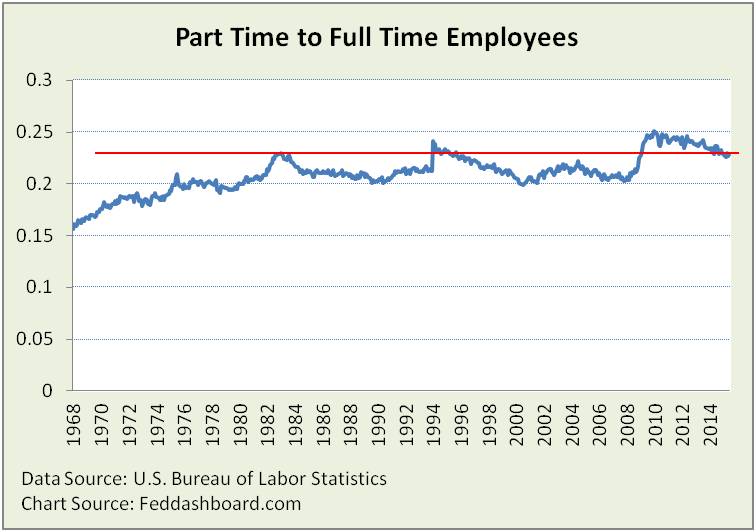
One reason may be that the ratio of part-time to full-time workers (blue line below) is historically high. One person with multiple jobs is counted at each employer, but not their hours worked.
 If growing hours decreased labor productivity, then in what industries are hours growing?
Getting a bounce off the bottom of the credit crash, nearly 80% of industries grew in hours from 2009-2014. About 50% grew by more than 1% annual average.
- Fastest growing (6-12% per year) industries were:
- Oil & gas
- Other information services
- At 4.5% was beverage and tobacco products
- At 3-4% were:
- Transportation equipment
- Warehousing
- Administrative and support services
- Primary metals
- Fabricated metal products
- Nonstore retailers
- Machinery
- Motor vehicle and parts dealers
- Food services and drinking places
Are trends similar in these industries? No.
- Oil & gas job and hours losses due to lower gasoline prices will appear as lower hours worked. This increases measured productivity as hours needed to ramp up production will drop more than output from maintaining lowest cost rigs.
- Industries with growing hours and already soft labor productivity are most likely to weaken. These include food services, and beverage and tobacco products.
- Industries with both growing hours worked and labor productivity are stars — nonstore retail is tops.
- Industries with weak productivity growth (less than 1% average from 2009-2014) are on our “watch list:”
- Utilities
- Petroleum and coal products
- Mining (except oil & gas)
- Automotive repair
- Fabricated metal products
Does this mean opportunity for investors? Yes.
- Industry averages still hide company variations. For example, one competitor might be leading or lagging others in trade-offs between people and technology, or be pursuing different business models.
- Superior evaluation of these company differences is a source of opportunity for business model investors. This includes seeking true productivity, not anorexic “lean” companies.
Special thanks to the BLS Labor Productivity industry team and their detail data that made this analysis possible. Learn more at the BLS labor productivity page.

