
8 July 2015
Real pay per person – “Pocketbook” – and net savings – “Piggybank” – measures help clarify the confusion of “mixed” jobs reports. These paint a picture of gradually improving real pay per person, net savings historically weak, and business and government change needed to adapt to the reality of the PIPE Factors.
Reading the Employment Situation release in isolation is often a mistake. This misses more helpful data from the Bureau of Labor Statistics (BLS) and other agencies.
Pocketbook measure is personal
The “Pocketbook” measure is Real Wages and Salaries per person. It’s about wages in the wallet for living and saving.
If jobs were scarcer, focus would be on job counts. Today, the problem is quality of jobs. Thus, pay is the focus.
So what’s the picture?
Improvement can be seen in quarter-to-quarter changes.
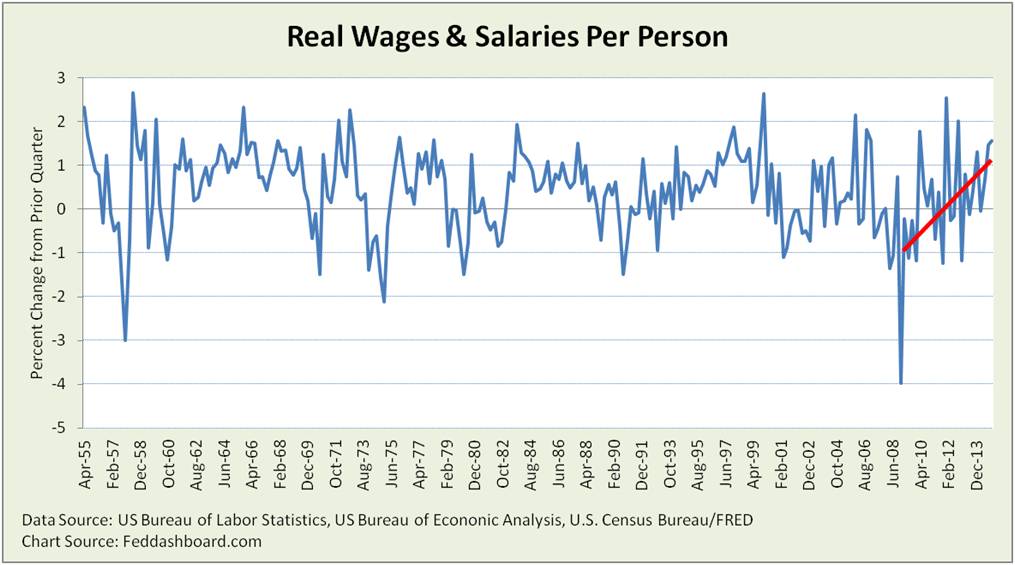 This shows steady overall progress and reason for the Federal Open Market Committee (FOMC) to take another step toward normal monetary policy.
This measure does not capture that nearly 30% of unemployed have been unemployed for over 27 weeks.
It also doesn not capture variations by industry and job type. Differences even in super-sectors are clear.
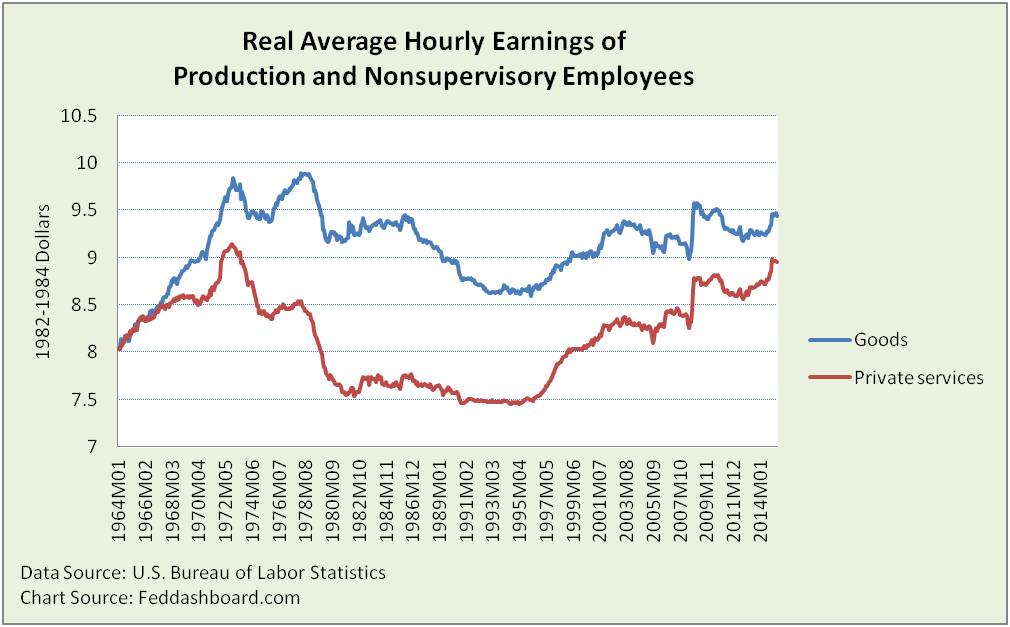 Of the 557 industries and sub-industries tracked by the BLS from 1991 to present for real average hourly earnings of production and nonsupervisory employees, just over 100 had greater than 1% average annual increases. Just over 100 had decreases.
Top 10 (Best first)
- Reinsurance carriers
- Radio broadcasting
- Investment advice
- Securities and commodity contracts brokerage and exchanges
- Grantmaking foundations
- Other financial investment activities, including funds and trusts
- Periodical publishers
- Securities, commodity contracts, investments, and funds and trusts
- Grantmaking and giving services
- Financial Portfolio management
Bottom 10 (Worst last)
- General freight trucking, long-distance Less Than Truckload
- Other specialized trucking, long-distance
- Warehousing and storage
- Motor vehicles and parts
- Motor vehicles
- Airport operations
- General warehousing and storage
- Motor vehicle power train components
- Motor vehicle metal stamping
- Motion picture and sound recording industries
Industry fortunes do play a role in pay. Striking is the role of technology. In some cases technology has displaced lower skill workers; remaining workers have higher skills and average wages. In these cases, people tend to drive technology. In others, technology displaced higher wage workers leaving people with lower wages driven by technology. Thus, understanding Exponential Technology (“E” in “PIPE Factors”) is critical.
To help fix these deep problems, improvements are needed from governments and businesses to adjust to the PIPE Factors.
Piggybank foreshadows future
The “Piggybank” measure is the difference between personal savings rate and new credit rate. It looks at how much people are saving relative to new credit. In the picture below, it is the purple line. The Piggybank measure gives a glimpse of the future as excessive debt constrains people’s future quality of living – especially retirement in an aging population.
 The Piggybank measure returned to good levels from 2Q2008 to 4Q2012, but today is weak by historical standards other than credit bubbles, especially bubbles that dragged the Piggybank measure to lows in 2Q1987 and 3Q2005.
Where’s the money going? Into current personal consumption – blue line below. In this light, recent consumption restraint is good.
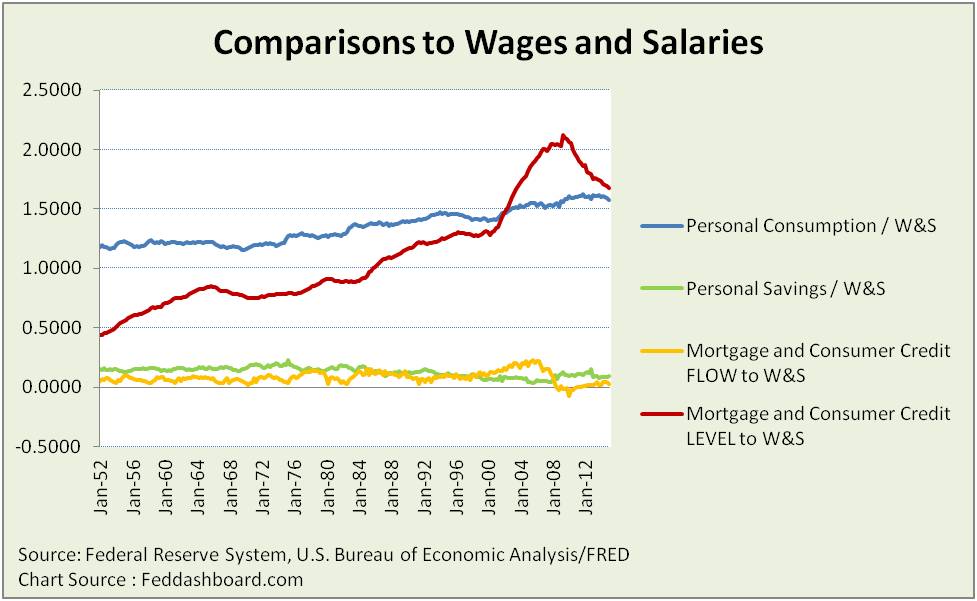 Good news is that credit levels compared to wages and salaries (red line above) are now down to 1Q2004 levels.
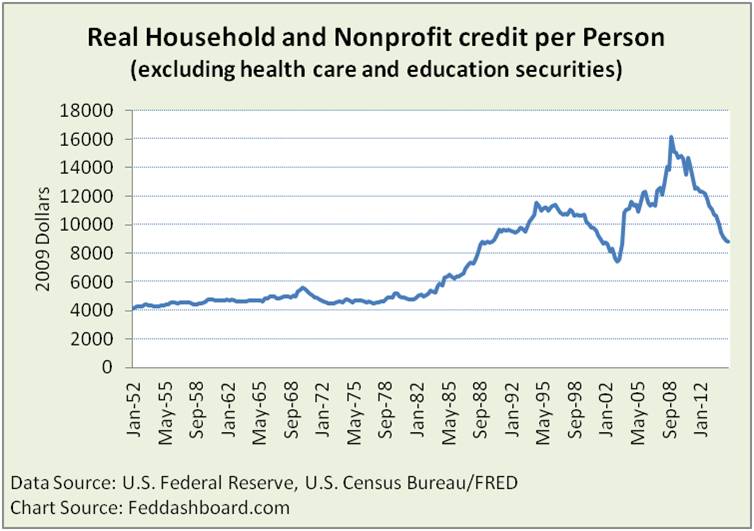
Below, credit levels per person also continue to drop, but still strained at more than double the trend through 1982.
Summary
- Good: Pocketbook measure shows moderate and improving growth
- Good: Debt levels are down from 4 times pre-1982 range to now 2 times. More decrease would be welcome, especially given worker retirement projections. More in “Black Friday – consumer confidence or deeper in debt?”
- Caution: Piggybank measure is historically weak, other than credit bubbles. Degree of danger depends on who is taking on debt and who is paying it off.
- Caution: Structural improvements are needed; impacts will vary by region, industry and company.
Implications
- Investors seeking company opportunities, can evaluate companies on the PIPE Factors – are companies leading, responding or lagging to these significant changes?
- Policy-makers seeking growth can revisit policies to enable smoother structural change in view of PIPE Factors.