
Investing “styles” are often difficult to distinguish due to fuzzy definitions and returns; then there is “drift.” To overcome these difficulties, look to contrast in cyclical versus stable companies to bring clarity to stock-picking.
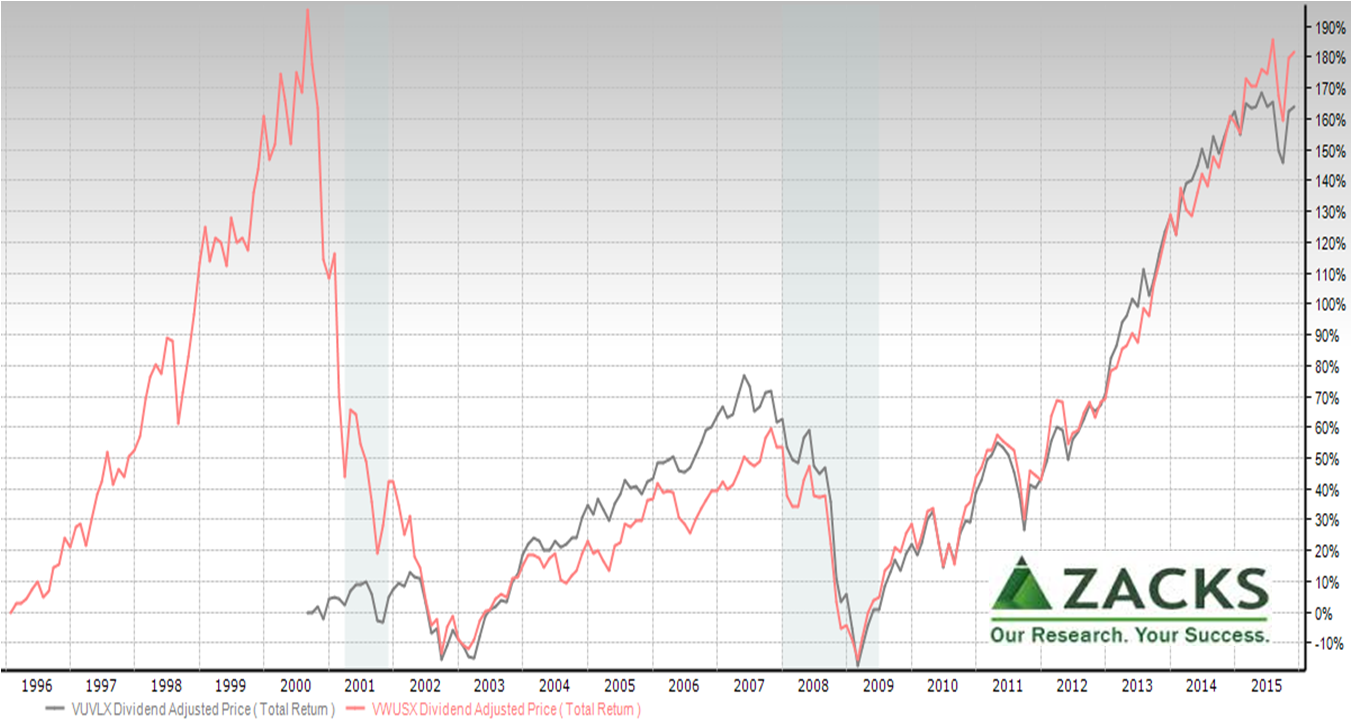
Investing “styles” such as growth, value and blended are often difficult to distinguish due to fuzzy definitions in marketing, SEC filings and portfolio manager decisions, as described in “Step 1 in 2016 – Buy the right stock “dots.” More, returns are often difficult to distinguish. For example, consider the popular Vanguard U.S. Growth (pink line) and U.S. Value (gray line) funds on a cumulative performance, Total Shareholder Return (TSR) basis.
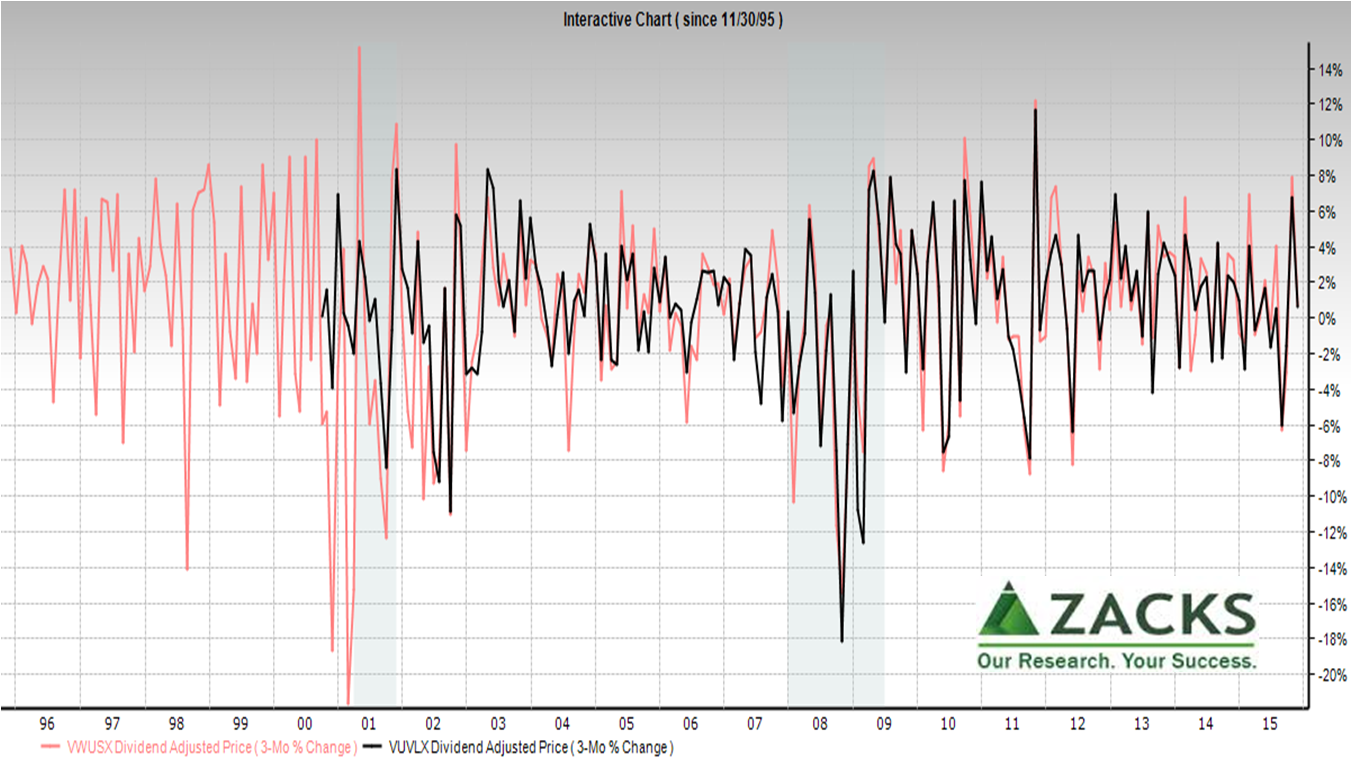
 On a quarterly change basis, the growth fund is more risky (volatile), but not always by much and less during the housing credit bubble crash.
 The point of different styles is to meet different investor preferences for stock picking or provide different risk/return combinations. But, too often styles “drift” according the SPIVA® U.S. Scorecard (S&P Index versus Active).
Is there a better way to slice and dice the stock dots?
Yes. First, start with the same stock dots. This is where Zacks composites are helpful because they are calculated with stocks that meet the criteria today and compare that group back through time (an “apples-to-apples” view). This is different from typical indices where the stocks change over time. Stocks coming in and out of the group cloud changing fundamentals.
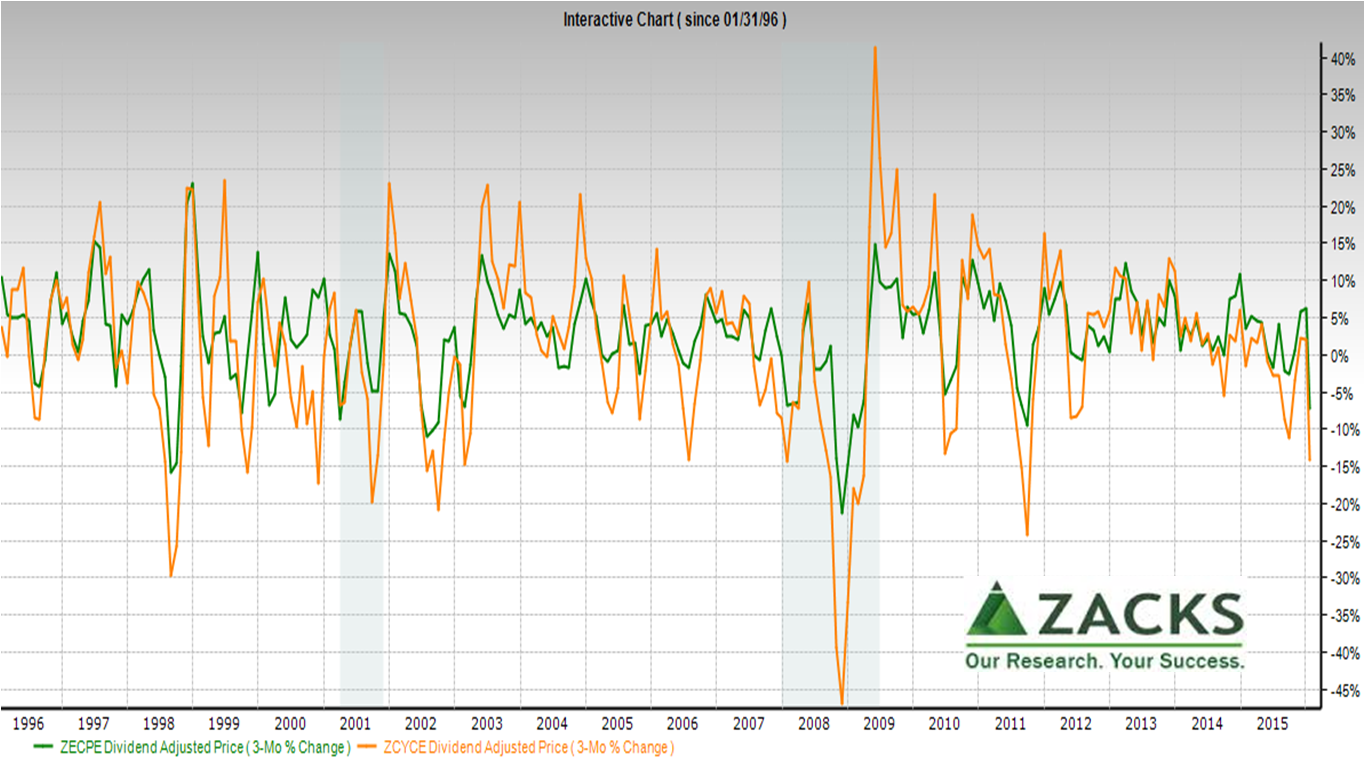
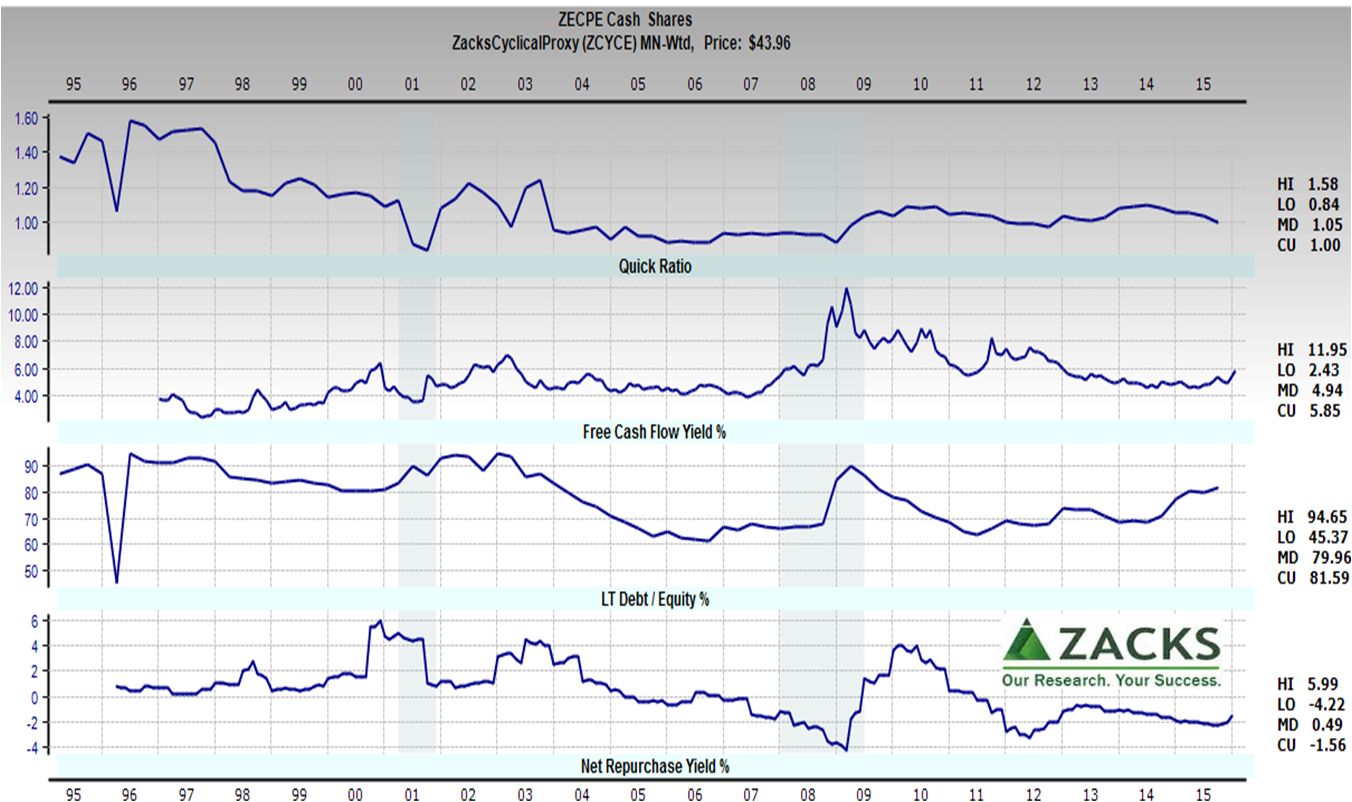
Next, consider two pre-loaded composites in Zacks Research System (ZRS). Zacks Earnings Certain Proxy (green) focuses on highly stable companies that produce consistent earnings. Zacks Cyclical Proxy (orange) focuses on economically sensitive large cap companies and excludes interest sensitive sectors (e.g., finance, utilities and telecom). Below these are shown on a quarterly percent change TSR basis. Zacks Earnings Certain Proxy is most always significantly less volatile.
 Using a “play the tops” strategy, cyclical stocks offer repeat opportunities to boost returns – IF actively rebalancing.
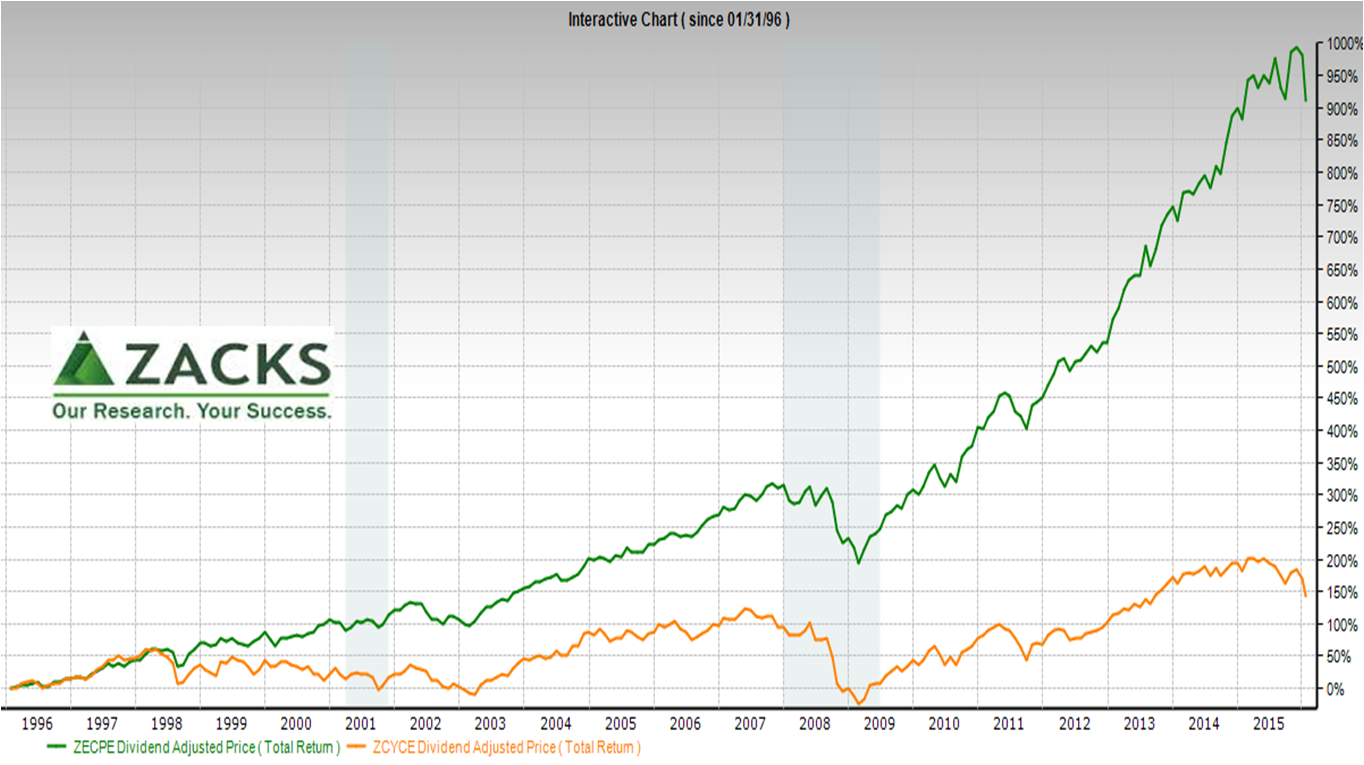
On an “apples-to-apples” cumulative performance TSR basis, Zacks Earnings Certain Proxy outperforms the Cyclical Proxy. As discussed previously in “Three pointers to safer dividends,” dividends are also more reliable.
 In short:
- The earnings certain (or “stability”) versus cyclical distinction is more crisp than the growth versus value distinction
- The earnings certain approach provides greater TSR than the cyclical approach, and popular growth and value funds — with less risk
These composites are not something you buy, but rather guides for picking stocks that meet your preferences.
What’s the Magic?
The magic is that method matters. Three principles stand out:
- “Sharp knife” principle – slicing and dicing the stock dots is not about quants rummaging through “big data” for correlations without causation. It must start with an causal reason for differentiating dots (“economic mechanism” in analyst-speak)
- “Took kit” principle – just like a “weekend warrior” doing home repairs, an investor is lost without the right tool. An investor trying to use a market data tool for investing is a bit like a plumber trying to fix a leaky water valve with a roofer’s hammer and nails. Tools like ZRS are made for investing.
- “Measuring” principle – continuing the home repair analogy… a measuring stick doesn’t get the job done when the job calls for a framer’s tool to measure angles before sawing a board. Notably, the ZRS Earnings Certain, Cyclical and other proxies are composited “bottoms up” with a “ratio of averages” from individual companies. This enables the “Tool kit” principle that then enables the “Sharp knife” principle. How? Because each proxy can be viewed in its fundamentals to adjust the criteria by which stocks dots are picked.
For example, consider these changing fundamentals…
 Clarity of change creates opportunity.
Does it get better?
Yes, for example:
- Stock dots can be sliced in other ways following this general approach. Examples above are just “out of the box.” For highly active investors, cyclical and earnings certain approaches can be combined – IF you have the tools to watch for early warning fundamentals.
- Stock screeners are “knives” that work best with a tool that enables testing many fundamentals
- Business model-based investing resolves opportunities at a more granular level.
Bottom line
- The earnings certain versus cyclical distinction is more crisp than growth versus value distinction
- Method matters for superior risk-adjusted returns
- Business model-based investing highlights opportunities