“Deflation” is good if purchases grow. Obvious to shoppers, people buy more when prices fall, especially when products have better features and it’s easier to find lower prices. This reveals growing abundance.
Purchases grow when price falls
Central banker fear of “deflation” (a word too loosely used) is that if aggregate price indices fall so will purchases, meaning recession or worse.
What’s happening with stuff people actually buy?
Thanks to the U.S. Bureau of Economic Analysis, we can take a shopping trip through about 360 product types of Personal Consumption Expenditures (PCE). For example:
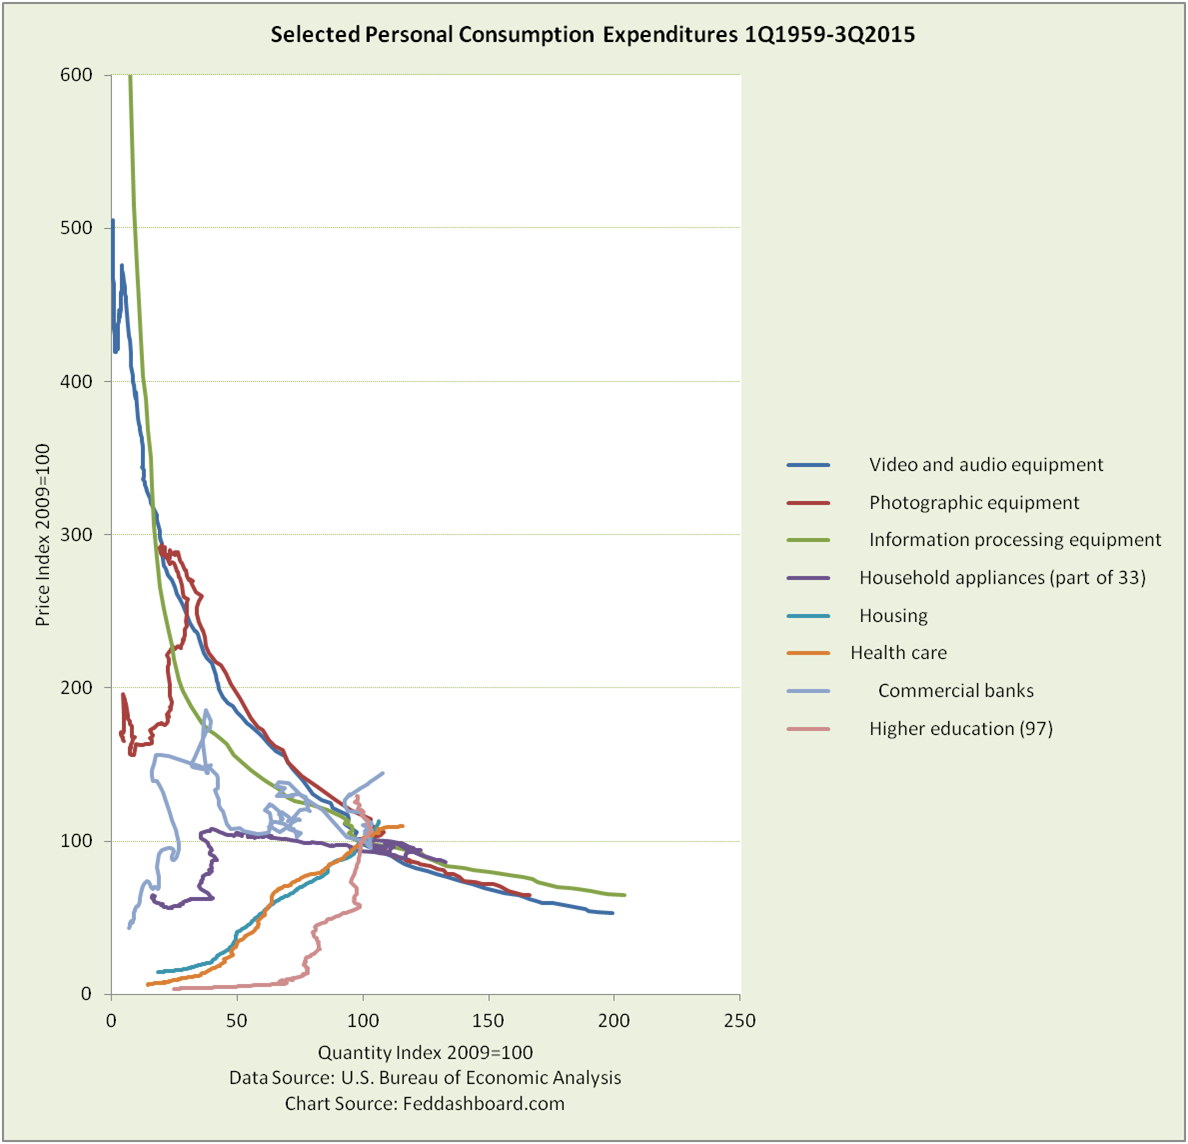
- Goods with prices falling at an exponential rate include information processing, video and audio, photographic equipment
- Household appliances represent gradually falling prices
- Commercial banking wanders under regulatory changes
- Housing and health care represent tandem price-quantity increases
- Higher education is rocketing in price
To put this in a picture, a “time-track” chart is used. Better than price indices alone, time-tracks add quantity purchased.
Time-tracks are created by playing connect-the-dots with the intersections of short run (quarterly) price and quantity data for products reported by the BEA.
 For the Federal Open Market Committee (FOMC):
- The assumption that most product prices move together is not true.
- The notion of a uniform price index to “manage” shatters against the reality of shoppers buying individual products.
- Monetary tools are blunt instruments. Other than buying mortgage-backed securities to drive up housing prices, the FOMC can’t change the specific price of an x-ray or kitchen juicer.
This is the FOMC’s inflation trap. Whether the FOMC tries to force prices up or down – they will distort some prices.
How does the FOMC pushing up prices on college tuition or mobile phones cause the number of phones sold or students in college to grow?
More broadly, “With purchases growing with falling prices, why do central bankers fear ‘deflation?’”
Fear of theory and phantom data
Theory says our economy is primarily supply-constrained by shortages of workers, skill, land and minerals. In time-track pictures, the more supply-constrained a product is the more upward-sloping a time-track.
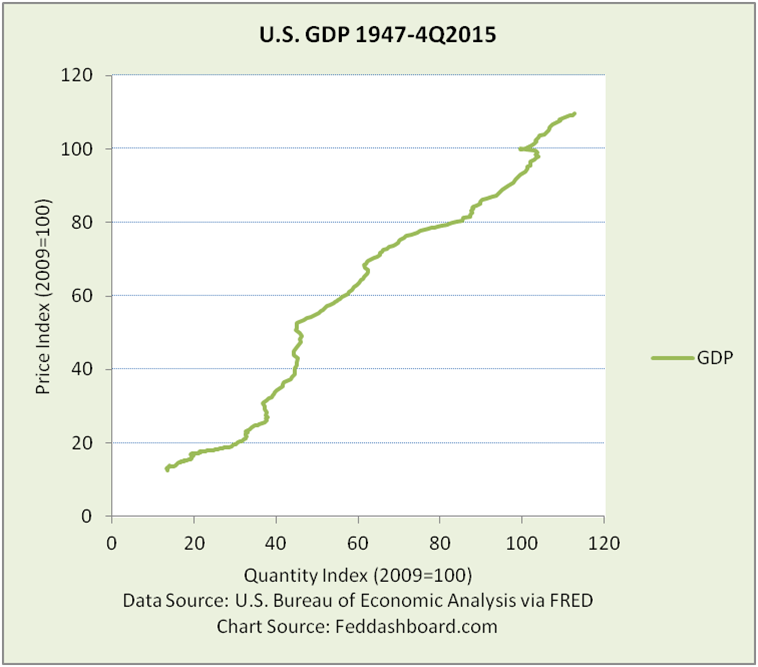
The broadest aggregate average is Gross Domestic Product (GDP).
This picture shows the reason for fear that if prices fall, quantity purchased will also slide backward down the time-track.
 But, GDP is not a product that can be purchased. It is an aggregate average – phantom data. Averages hide answers.
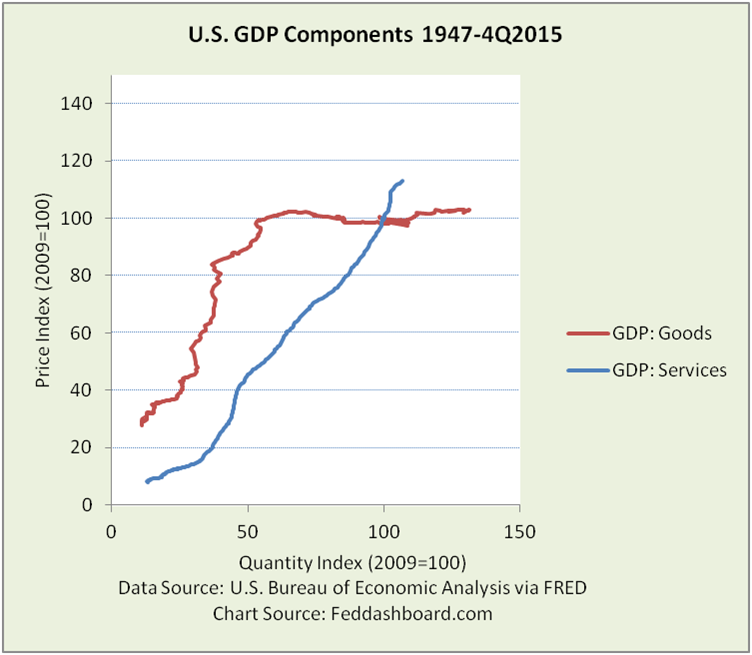
Have goods and services behaved the same? No.
The average price of all goods mellowed in the mid 1990s.
Did flat or falling prices lead to falling purchases? No, purchases have grown for 2 decades (other than the credit bubble crash).
 These big buckets and the product types in the first chart show purchases grew with flat or falling prices.
In time-tracks, purchases growth helps distinguish good from bad
- Vertical time-track reflects some mix of severe shortages or 1970s-style “stagflation” or regulatory/subsidy policy
- Upward-sloping reflects supply-constraints (shortages of raw materials, workers, less technology and/or higher production costs) or regulatory/subsidy policy
- Horizontal reflects some mix of abundance and low consumer fear, call it “Smooth Growth”
- Downward-sloping reflects less supply-constrained (including global trade), call it “Abundant Growth”
Broader influences include: money supply, interest rates, debt level changes, tax and spend policy, regulatory policy, natural disaster, political or civil unrest, or any cause of a shift in or move on a short run supply or demand curve, including change industry structure, costs and competition.
Specific product stories show trend endurance
We search for context and causes by moving from product types to specific products to retailers, distributors, manufacturers, designers and researchers. This is just like a corporate product manager or fundamental investment analyst. For the product types in the first chart:
- None have shortages beyond those created by regulatory policy
- All have causes that started before and lasted after the 1970s stagflation
- Trends persist despite affects of taxes, exchange rates, new model introductions and sales mechanics.
Decades of growing purchases and falling prices evidence the error of “spiraling deflation” – fear buyers will defer purchases waiting for prices to fall. Experience since 1980s with computers and audio-video equipment shows it’s more about consumers waiting for latest model. After 3 decades, sellers have learned about product launches.
Notable context and causes are described with the PIPE Factors (Pacts for trade, Intellectual and physical capacity for production and trade, Peace-building, and Exponential technology). Technology (especially “3S’s” – silicon, software and scalable platforms) is a powerful contributor as discussed at Singularity University.
Exponential technology has reshaped products – look at your mobile phone (device and service).
It is not just tech inside a product. It’s the ripple effect through entire product path from “research to retail,” (including effects in retailers like Costco or Amazon). Tons of tech goes into your purchase of a wooden garden tool.
Shoppers long ago sensed change
The first chart was about individual product time-tracks. Dynamics across products become visible by plotting together individual product changes. The picture below contrasts goods before 1972 (before credit cards, oil shock, Bretton Woods collapse and “stagflation”) and after 1995 (after Goods time-track turned flat).
 Note: For visibility, axes trimmed; several influential goods post-1995 are off the chart to the lower right.
Striking are:
- In both eras products are arrayed along a downward-sloping power curves, not the upward-sloping curve of scarcity-based theory. This means more demand-driven.
- After 1995, products are on a far tighter fit to the downward sloping curve, reflecting PIPE Factors of supply and 4Cs of demand. Exponential technology powers both lower product costs from “research to retail” and easier price shopping.
PIPE Factors and 4Cs aren’t going away — barring war, disease or natural disaster that causes shortage or fear.
“Abundant Growth” is science future becoming science reality. Great for consumers, it also heralds difficult dislocations for which society must prepare.
Bottom Line:
- Policy-makers must stop using outdated data, recognize today’s time-tracks, stop creating distortions with attempts to drive up prices and prepare for lower natural rates. This applies to both developed economies and to developing economies that may be skipping their manufacturing-based eras.
- Investors can find opportunity by reading the increasingly 3S’s (silicon, software and scalable platforms) -based economy the way they would analyze companies such as Apple, Google, Amazon, Netflix or Uber.
Special thanks to Kathryn Myronuk of Singularity University for her detailed comments.
