
Why do stock markets grow? Of many reasons offered, just one driver dominates in each of 5 post-WWII growth eras. These distinct eras with different drivers raise the need to rethink conventional wisdom on business cycle similarity, bull market rebound comparisons and popular investment methods.
*** If you arrived here from the Yahoo! Finance video, you may wish to read the replies to the data and method questions. ***
Since 2009, the Federal Open Market Committee (FOMC) has been the defining force in markets (see https://feddashboard.com/how-to-dx-fx-fundamentals).
Where else might we look to find forces with an outsized impact? After filtering the data, it appears GDP, debt and chasing stock dreams in new technology deserve a closer look.
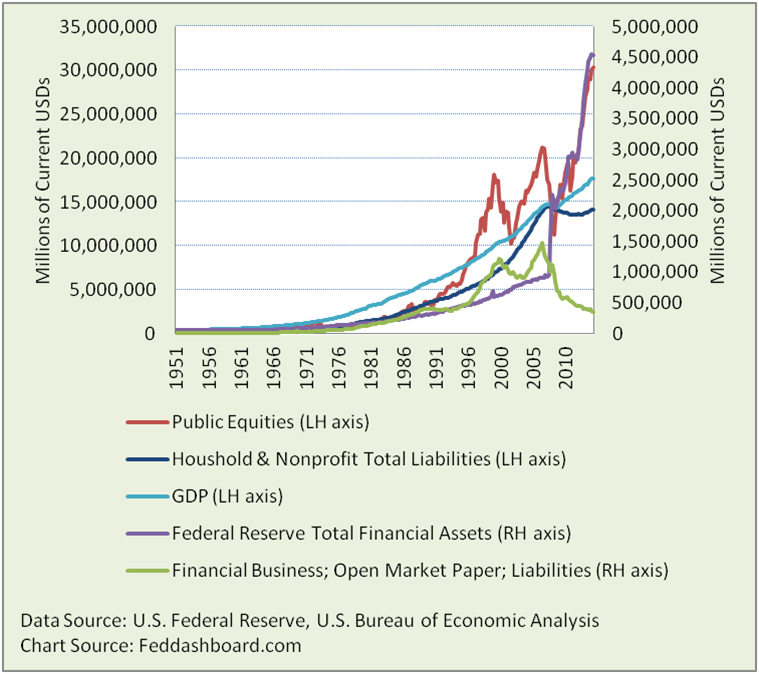
The dark red line shows the growth in the Federal Reserve’s measure of Public Equities (an index of everything).
If Public Equities grew in 1:1 proportion to a specific driver such as GDP, then that ratio would be a roughly level line across a graph.
To visually search for growth drivers, our hunt is for level lines.
So what creates level lines we’re hunting?
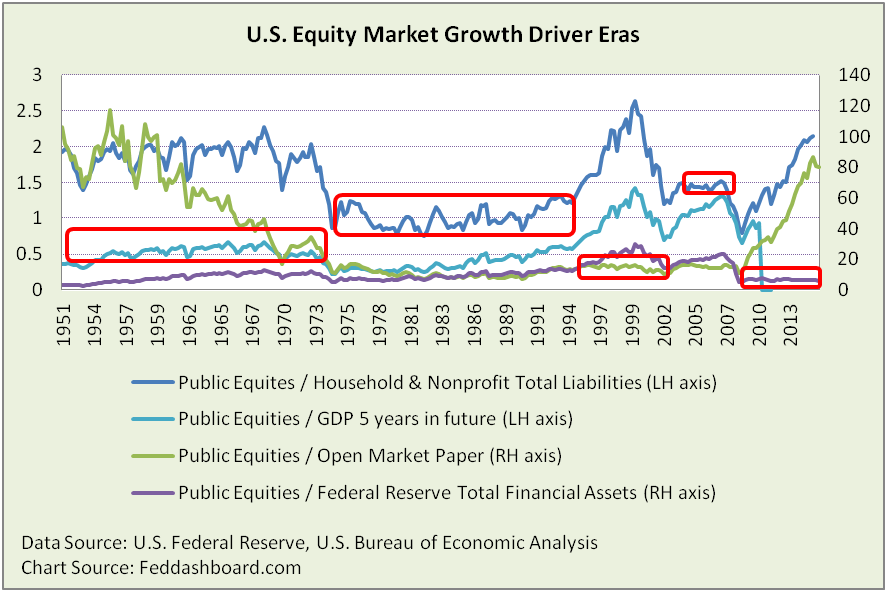 It turns out no single force dominates. For example, equity value starts straining above Future GDP in the 1970s. Different stable relationships of market growth drivers occur in distinct eras – highlighted in red.
Connecting the lines in the red boxes with a bit of financial gene-splicing, it’s easier to see what defines eras.
 Notes:
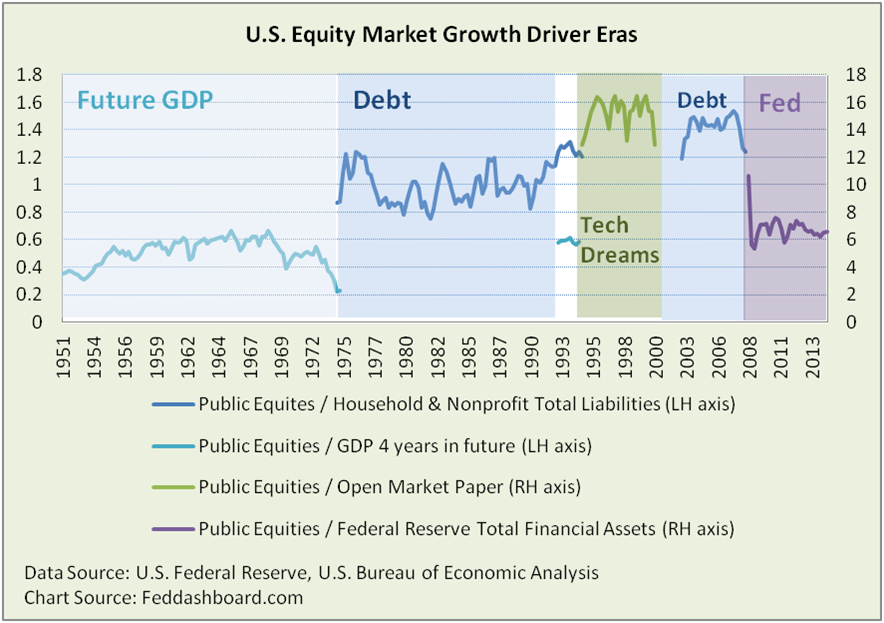
- Vertical variation is greater in this picture than prior picture because the vertical scale is much smaller.
- Magnitude of stability can be seen by comparing to the prior picture. Tails are included to make it easier to see transitions.
- Vertical differences in different line segments have no meaning as each ratio has its own history.
Era 1 – Future GDP
- Finance textbooks explain how expectations of future growth drive current share prices. Fundamental analysts forecast 3-5 year growth rate as “future.” If equity value is divided by actual GDP five years in the future (and hoping forecasts were in the ballpark) we see a relatively stable relationship.
- However, this relationship mostly ended in the early 1970s, a seminal period marked by the end of post-WWII population growth, oil troubles, and a variety of historical pivot points in labor, income and more that we’ve discussed in prior analyses. Today, the Strain Gauge is measuring historically high strain between financial asset prices, and tangible goods and services (Business GDP) https://feddashboard.com/strain-gauge-hits-15-year-high-do-you-know-why.
- Future GDP explains a whopping 90% (r-squared) of equity value growth in Era 1.
Era 2 – Debt
- Era 1 was about anticipation of future growth. Era 2 is the opposite, borrowing from the future to spend today. As discussed in multiple analyses at https://feddashboard.com/category/conscredit, debt grew in several stages with upticks in 1982, 1995 entering the Treacherous Triangle and again about 2000.
- Household and Nonprofit Sector debt growth explains a huge 95% of equity value growth in Era 2. Reading the pictures closely, the Public Equity to Future GDP line in the late 1970s has less variation than the equity-debt line. However, equity was consistently straining above Future GDP, whereas it was fluctuating against debt, so the overall Era 2 nod goes to debt.
Era undercurrents
- Crossing eras 2 and 3, equity value pulled above of all the broad measures. This growth seems to reflect two drivers that briefly dominated markets as shown by the white space in the above picture.
- Tangibly, exponential technology gathered power in 1981 and transformed our economy by 1995, see https://feddashboard.com/no-fear-of-deflation-if-cause-is-pipe-factors.
- Financially, autonomous financial markets also sparked about 1981 – enabled by technology, see https://feddashboard.com/situation-status-and-organic-growth-imperative.
Era 3 – Tech Dreams
- Historically, stock dream-chasing is usually positive for innovation. The less debt used for dream-chasing, the less damage when the bubble bursts.
- As a measurable proxy for this dream-chasing, “Financial business; open market paper; liability, Level” from the Federal Reserve is used as it was prominent in the tech and credit bubbles before withering due to post credit crash regulatory changes.
- Open Market Paper explains about 97% of the equity value growth in Era 3.
Era 4 – Debt part deux
- Especially through mortgage debt, Household and Nonprofit Sector debt explains about 94% of equity value growth in Era 4.
- More at https://feddashboard.com/category/conscredit
Era 5 – Fed
- From the beginning of extraordinary monetary policy through 1Q2015 (most recent reported), Fed action explains over 93% of equity value growth. In some periods such as 1H2013 (beginning of “QE3”) Fed action was almost entirely responsible for equity market growth (as though 93% wasn’t enough). Of course, this includes cascading impacts starting with wealth effect and fueling debt.
- More at https://feddashboard.com/how-to-dx-fx-fundamentals and https://feddashboard.com/category/money-prices.
Time to rethink
These distinct eras with different drivers raise the need to rethink conventional wisdom on business cycle similarity, bull market rebound comparisons and popular investment methods.
The next era seems to depend on:
- How fully will policy-makers digest this data and implications for actions?
- How will consumers adjust? As in our analyses of housing, willingness to bear debt is murky. Recent data suggests consumers on average are again expanding beyond their means. But, we don’t know debt loads on individual households.
- How will trader psychology play out in this situation where the Strain Gauge is so high, FOMC is seeking to normalize and shocks happen.
- How will investors analyze? While fundamental investment principles change little, metrics in a given era must match the situation. Stale measures distort the “market view” and cause investors to make suboptimal decisions as described in https://feddashboard.com/4rs-help-you-see-the-shift.
Complicating the future view are the soft or psychological questions that shape how decision-makers determine what data to read, evaluate that data and then apply an analytical approach to make a decision. For investors, clarity is helped by applying business model-based investing.
NOTE: Data updated 6 March 2016 with data through 3Q2015