
As headlines fuel fear about potential weakness in back to school clothing sales, a back to school education makes clear that prices are at 13 year highs and purchases per person are at all time highs.
Clothing and footwear, like most all products since the early 1990s, have been falling in price. This has not been a dreadful “deflation” because quantity purchased increased as price fell – classic demand curve.
We see this clearly in the price-quantity time track of consumer expenditures.
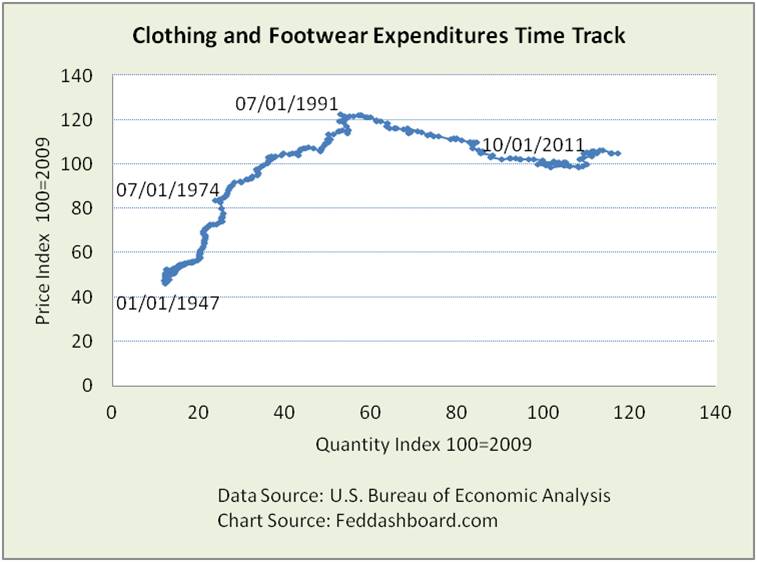 What is different from other products (see https://feddashboard.com/no-fear-of-deflation-if-cause-is-pipe-factors) is the 2009-2011 twist. So what happened?
Our story begins with the 2008 cotton price plummet due to dramatic moves in cotton futures trading. In February 2009, prices rebounded. At first the price rebound reflected stabilizing cotton financial markets. Then, a new boost hit.
Bad weather in the 2010-2011 growing season in Australia, Pakistan, India and the U.S. drove prices to peak in late summer 2011.
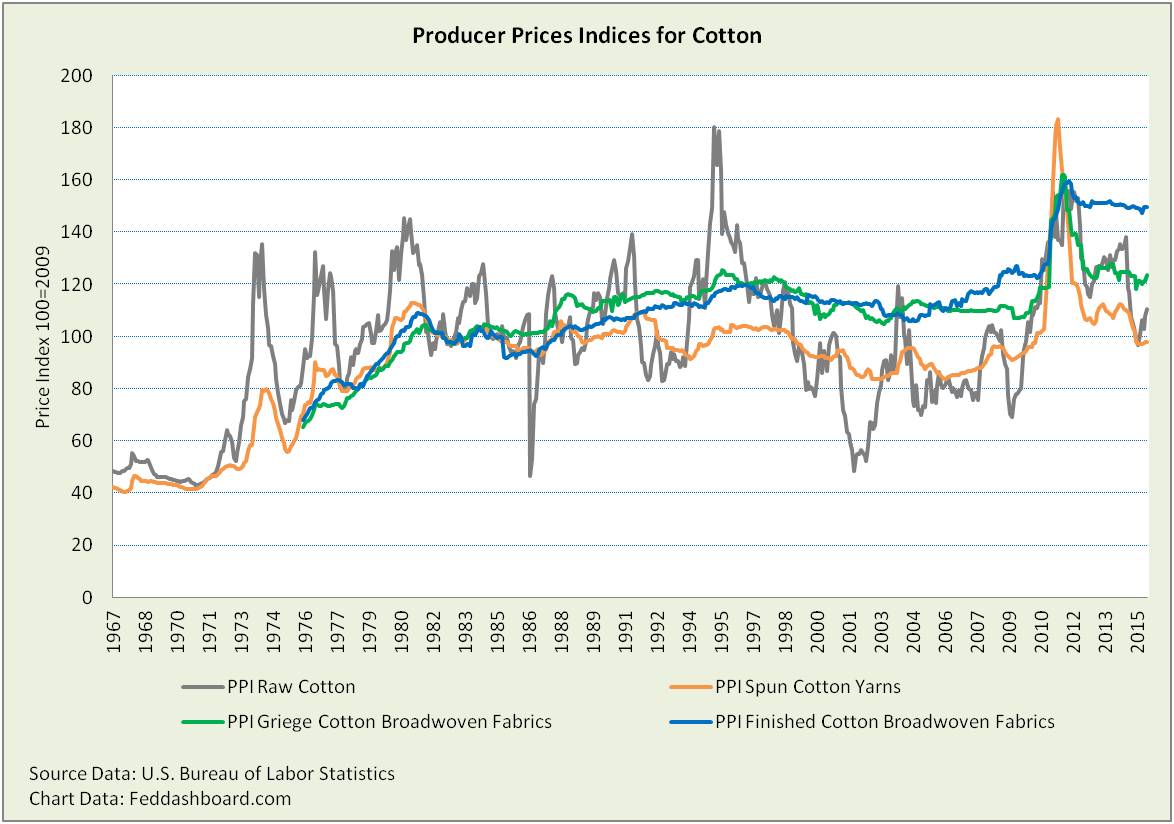 We would expect prices to fall in the next crop season. Raw cotton and yarn prices did fall significantly. But something curious happened — fabric prices fell more slowly. Griege/loom/unfinished fabric fell less. Finished fabric fell far less. So finished fabric and clothing (in prior picture) prices were “sticky” in falling. Why?
Our story of stickiness starts with consumption.
While underwear might be a bit of a necessity, most clothing is not. U.S. consumers have increasingly indulged in clothing. This indulgence hit a wall in the credit crash, but bounced back to all time highs. 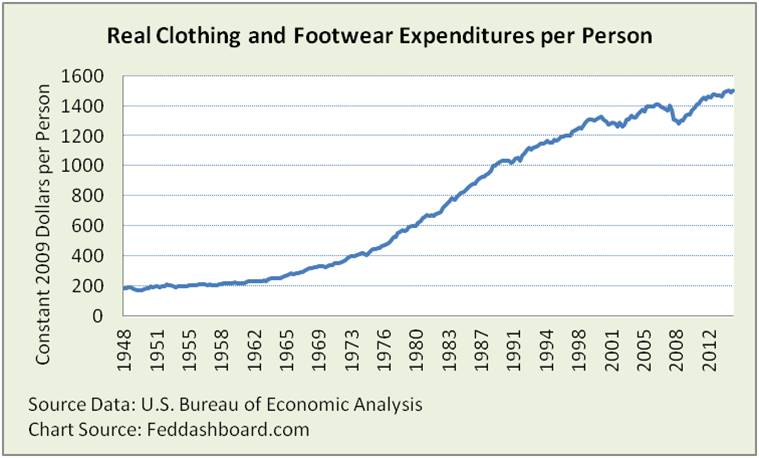
Manufacturers and retailers took this opportunity to reconsider pricing strategies with some solid B-School-style data analytics. Realizing consumers with cash are willing to pay for fashion; they sharpened customer segmentation and increased prices where possible. This pulled up average prices.
Importantly, remember the crash was a credit crash. It is good when people pay down debt and cut discretionary purchases. Yet, since March 2011 debt has been growing again https://feddashboard.com/consumer. More debt reduction would be structurally healthy for our economy.
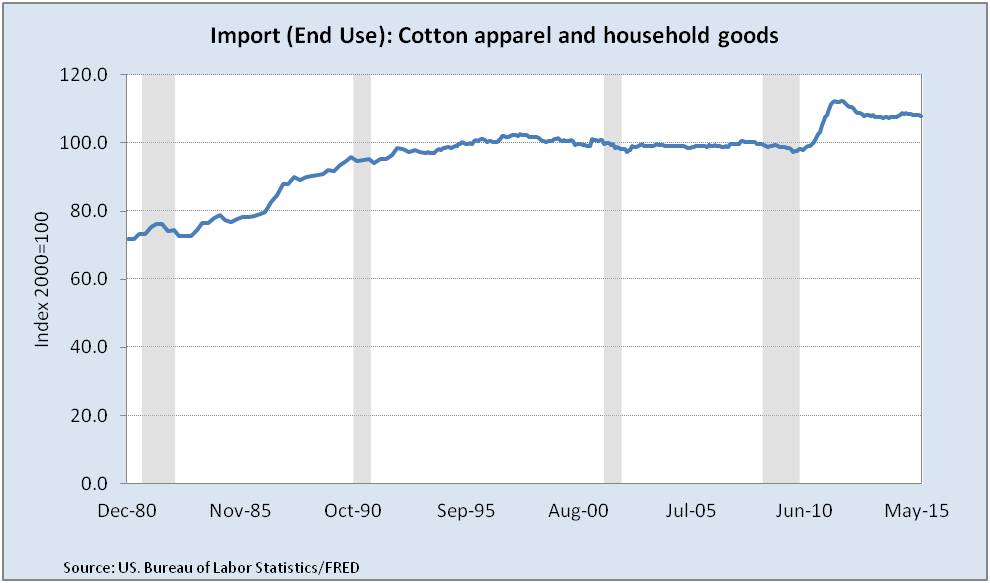
Imported clothing prices have also been sticky, not falling back to their stable levels of the prior 15 years. As about 40% of U.S. clothing is imported from China, one contributor to the original increase was China appeared to use more cotton than it produced in 2009-2010. But, following higher average U.S. retail prices, imports enjoyed stronger margins. The opportunity to sell clothing to U.S. markets above historical prices is a reason several countries are eager to join with the U.S. in the Trans-Pacific Partnership trade pact.
 In sum,
- Clothing prices are at 13 year highs and per-person real clothing spending is at all time highs.
- Prices of clothing, like the average of all other products (https://feddashboard.com/no-fear-of-deflation-if-cause-is-pipe-factors), are dropping — and quantity purchased growing.
- July advance estimate clothing store sales reported by U.S. Census Bureau is up 3% year over year, up 7% from May down 4% from June – of course, subject to the usual error ranges.
- Multi-year trends are more significant than monthly fluctuations, especially for advance estimates.
- A weaker Yuan will either reduce prices or improve retailer profit margins.
Reduced real purchases will be welcome if it means consumers are strengthening their household balance sheets (https://feddashboard.com/category/conscredit).