
The Fed’s flight path depends on knowing the “natural interest rate” for stable economic growth. The problem is that past actions make finding that natural rate like groping in a dark room. Better lit data illustrate less cash is needed for production and more cash is available – thus, the natural rate is lower.
The “Federal Funds” rate is a path for the Fed to achieve its objectives of “maximum employment, stable prices, and moderate long-term interest rates.” This rate is often described like the accelerator pedal on a car, if the economic engine is going more slowly than “potential” Gross Domestic Product (GDP) the target Federal Funds rate is lowered, pressing down the accelerator, opening the engine throttle and firing the engine to higher RPMs. “Potential” GDP means making full use of available people and physical resources.
Federal Funds Rate and GDP
What do we see in the data? This time track of real Federal Funds rate to real GDP begins 3Q1954. It has never been a smooth relationship.
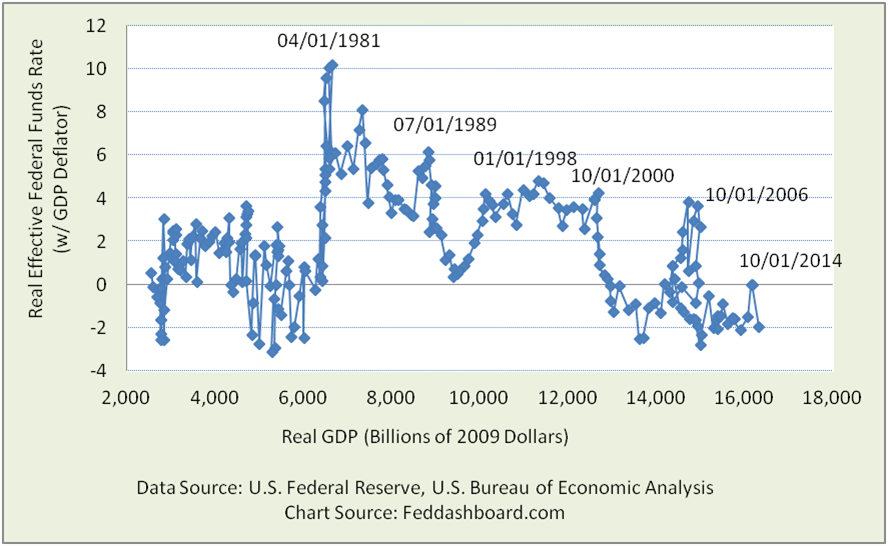 Note: This version of a popular chart uses publicly available data to provide a longer history and inflation-adjusts the Effective Federal Funds rate with the GDP deflator, as opposed to an implied rate from futures contracts or other approaches. A picture of the implied rate for just the past 20 years and a range of natural rate estimates are in Liftoff and the Natural Rate of Interest. There are several ways to plot, including smoothing, leading/lagging and percent changes.
This fluctuating chart reminds us that more drives GDP than interest rates. For a view of drivers through history, see the Real Rates – Real People Curve.
And more than GDP growth weighs on the members of the Federal Open Market Committee (FOMC), such as foreign exchange rates.
The FOMC attempts to adjust to hills in the road by adjusting the accelerator pedal. To find the “right” pressure on the accelerator, the FOMC needs to align the Fed Funds rate with the “natural interest rate.” The natural interest rate is the price of money that would enable GDP to grow at its potential assuming no other shocks.
Finding this natural rate is a bit like groping in a dark room because of several actions that each dimmed the light:
- Multiple monetary interventions
- Banking regulation constraining borrowing beyond incentives of interest rates
- Dramatic rise of autonomous financial markets that obscure the use of cash for producing nonfinancial goods and services
- Red dots of imports and globalization
- Robo-car effect — financial markets trading on expectations of FOMC rate changes – like a robot car anticipating acceleration changes based on road conditions ahead. Thus, that “natural” rate the FOMC is trying to observe is being altered by their attempt to observe it.
So in this darkened room, how can we shed light on the natural rate?
Your car isn’t like Fred Flintstone’s feet on the street. Your engine connects to your tires through the gears of your transmission. Especially with cruise control and an automatic transmission, you hear your engine rev and gears shift.
FOMC action also goes through the transmission of a business production gearbox.
If we can see what gear the transmission is in, we gain a pointer to the natural rate. In particular, if the amount of cash needed for production changes due to technology, methods, imports and more, then the natural interest rate changed.
So has it changed?
Cash for Production
An answer comes from looking at combined investment in equipment and structures plus employee compensation, then compared to corporate business production (Gross Value Added).
From 1947 to 1983, this ratio fluctuated in a range, with a slight uptrend starting 1963. From 1983 to 1991 it was in a very tight range, just over 80%.
In 1991, a downtrend began, broken by the tech and credit bubbles and now slightly recovering.
Costs of production were reduced by a range of technology, especially exponential technology, with 1991 marking a new phase of moderating goods prices, more in No fear of deflation if cause is PIPE Factors.
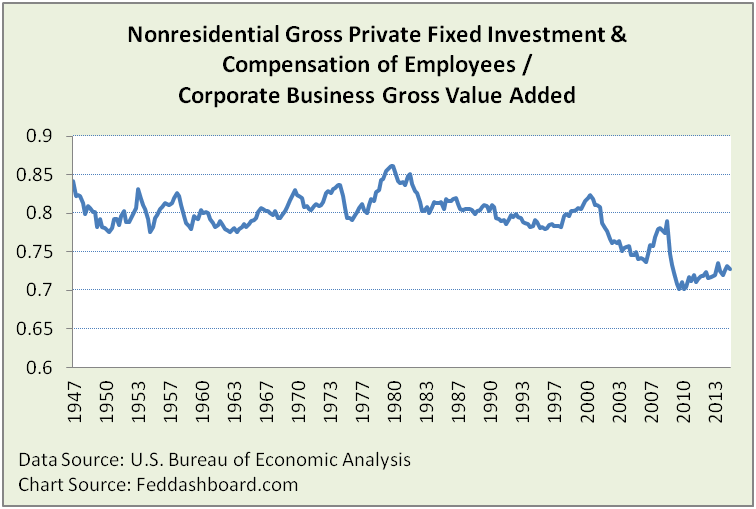 Note: Nonresidential Gross Private Fixed Investment is equipment and structures, not including intellectual property. Compensation of Employees is for Corporate Business.
Just as in Read Between the Lines to Solve the Productivity Mystery, decrease in Structures pulls down the average of fixed investment, especially a drop in 1991/1992. Structures investment is important is it likely to be financed whereas compensation is usually paid from operations.
A more specific view comes from Zacks Research System using corporate filings with the U.S. SEC.
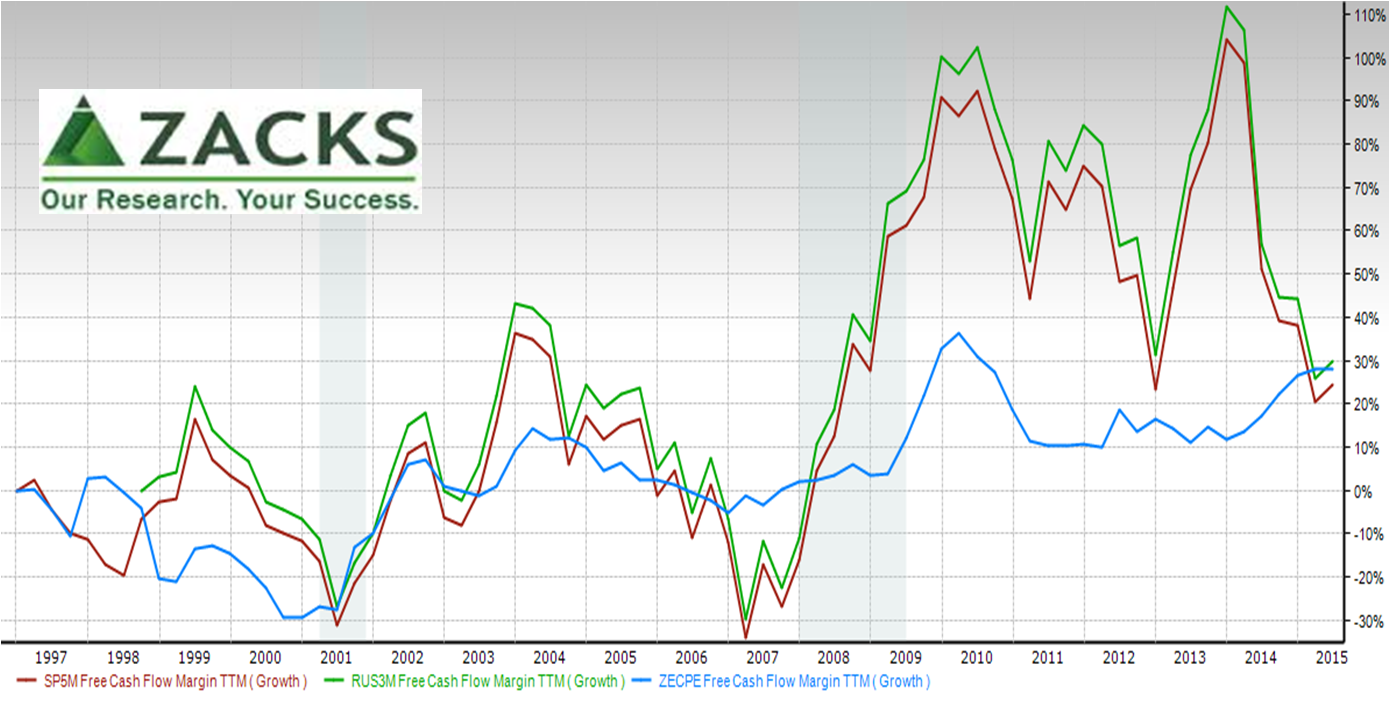 Here, Free Cash Flow (FCF) Margins (cash flow after change in Property, Plant and Equipment) for S&P500 and Russell 3000 companies fluctuated and net grew over time – the transmission gear changed.
Of particular help is the Zacks Earnings Certain Proxy. It focuses on highly stable industries that produce consistent earnings.
Even for this stable group, in the first two quarters of 2015 the Zacks Earnings Certain Proxy FCF margin was about 24% above its 2003-2007 average – a different gear.
FCF margin gives us a net view relative to sales each period. So what happened over time?
Sources of cash – businesses
In 1991, nonfinancial corporate businesses began growing their cash and marketable securities compared to production. This broke from the relatively stable ratio of about 1970 to 1990.
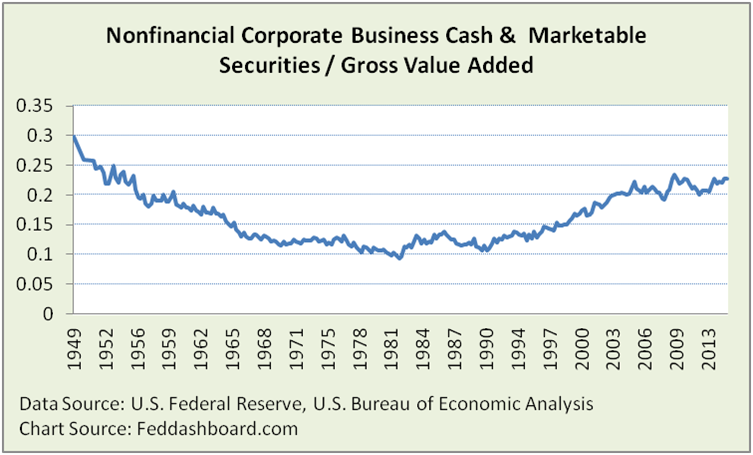 Note: “Cash & Marketable Securities” includes Federal Reserve data series for: Total Currency and Deposits, Mutual Fund Shares, Security Repurchase Agreements, Money Market Mutual Fund Shares, Agency and GSE-backed Securities, Treasury Securities, Commercial Paper, and Municipal Securities and Loans.
Zacks Research System again helps us be more specific using Zacks’ market-weighted composite of S&P 500 companies.
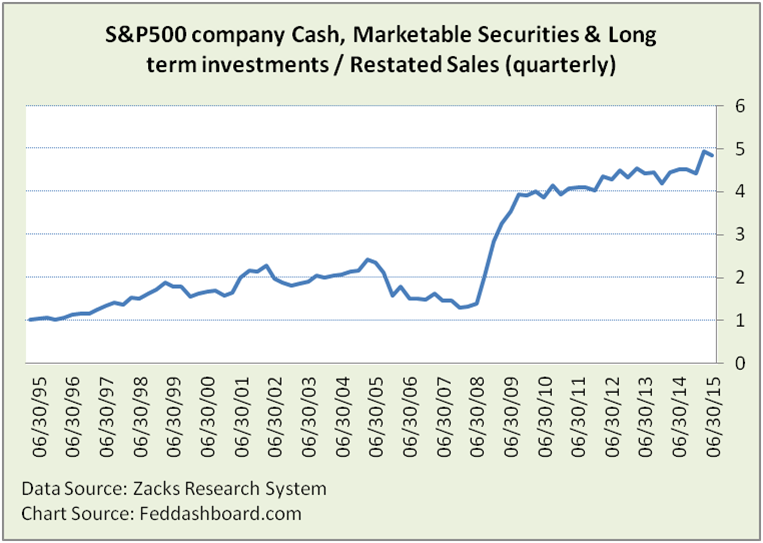 Note: Long term investments are included because companies with large cash balances (e.g., Apple) are deploying them in ways that appear in the long term investments line of SEC filings, rather than the cash and marketable securities lines.
Big corporate cash is running 2x 2003-2007 levels. This is before businesses tap cash from households and nonprofits (think education and hospital endowments) that Econ 101 says are the primary source of business financing. How is household cash running?
Sources of cash – households and nonprofits
Since 1991, cash has been shifting to financial markets, with the total growing (recently thanks to the FOMC bubbling equity prices). Of course, averages hide significant differences within individual households. Beyond this U.S. cash is cash from global sources.
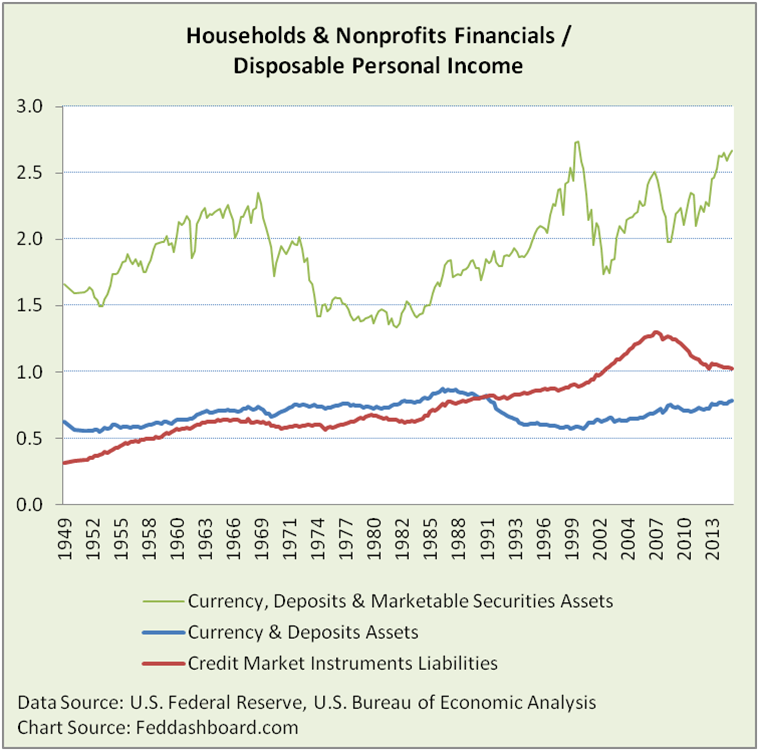 Note: Credit Market liabilities include home mortgages, commercial mortgages, consumer credit, other depository institution loans, and municipal securities (Federal Reserve FL154104005.Q)
In short, businesses collectively don’t need households as in the past and households (plus nonprofits and global savers) have more funds.
Together, the need for cash to produce has been falling and the supply of cash has been growing. The gear shifted.
Fed’s frustration
Targeting the Federal Funds rate based on the gap between current and potential GDP, mostly forces the FOMC into some combination of 1) assuming the natural interest rate is where it was vaguely seen years ago or 2) trying to find the natural rate in today’s darker room.
Data Light
Shifts in the business gearbox help illuminate the natural rate.
Digging into the data, less cash needed for production and more cash available both suggest the real natural interest rate is now lower.
For monetary policy makers, this illuminates future policy moves, and prepares for life with lower rates and when an increase in the Federal Funds rate might transmit less lift to other rates than in past.
For investors and businesses:
- Reinforced is business model-based investing as that is the company-level view of the cash-to-production macroeconomic data.
- New is the need to observe how policy makers react to these structural changes. Investors can search for opportunities to arbitrage slow Fed reactions.