Growth in real incomes for people in Japan, especially younger workers, signals to the Bank of Japan that is time to shift to its next strategy and signals younger people to have more babies.
Personal income growth around 2% adds to our prior analyses of the strength of purchases by the average Japanese shopper.
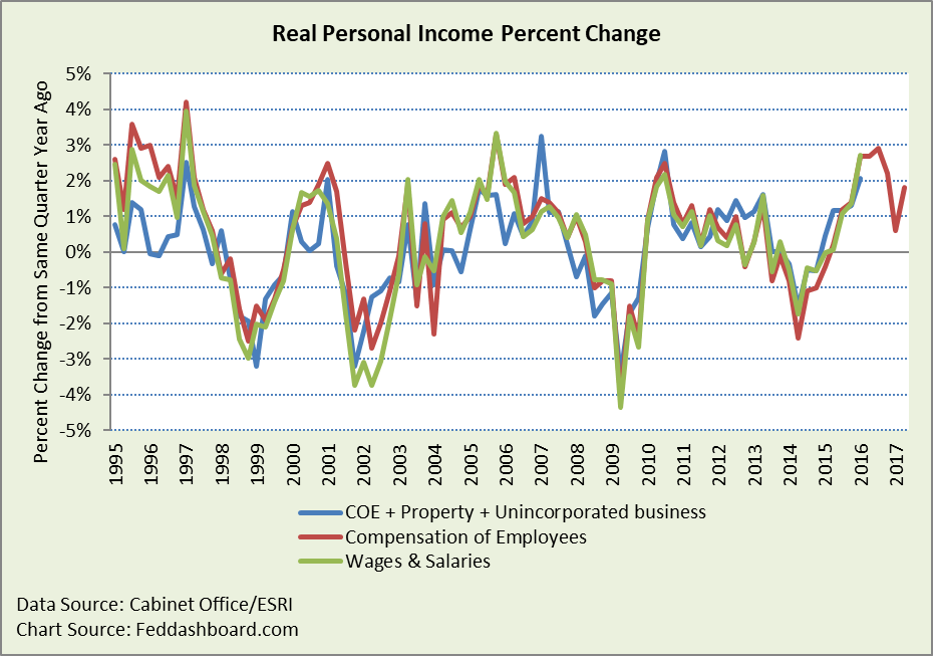
Data from the Cabinet Office, Economic and Social Research Institute, shows personal income growth rebounding since 2Q2014 – with strength not seen since 1995-1997. Causes of the 2013-14 weakness are mostly quantitative easing (QE) starting in 2Q2013 and increase in the value added tax to 8% from 5% in 2Q2014.
Shown below are three measures of personal income:
- Broad personal income that combines compensation of employees (COE), property income and unincorporated business income
- COE that includes wages and salaries plus benefits
- Wages and salaries shown alone because employees are often thought to behaviorally respond most to just wages and salaries
 The 1Q2017 real COE drop was mostly because gas prices jumped 20%.
This is surprising to many who recall stagnating wages in other reports. But, those reports often use a different adjustment for price level changes over time. Instead of using the Final Consumption Expenditures of Households deflator, other reports use the Consumer Price Index. CPI calculates more price level increase than does the household consumption deflator. Thus, real wages (nominal wages adjusted for price level) are lower. Because of the calculation differences, the U.S. Federal Open Market Committee prefers the consumption expenditures deflator to the CPI. We follow the same approach with Japanese data.
As we often say, “averages hide answers,” so what’s hidden in Japanese wage data?
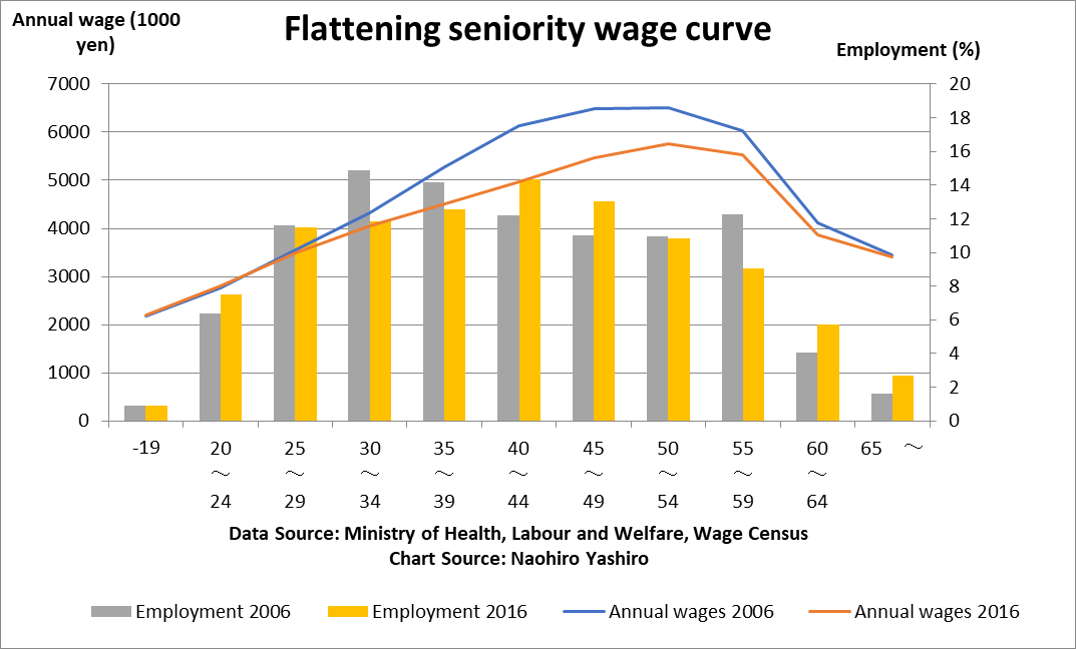
For insight, we turn to Naohiro Yashiro, a labor economist and dean of the Global Business Department at Showa Women’s University in Tokyo. He analyzed the monthly reports from the Ministry of Health, Labour and Welfare by occupation and age.
Dean Yashiro explained in an interview with South China Morning Post, paraphrased here, “There is a shortage of manual workers, but an excess of white-collar workers, especially middle-aged men. The government has set an inflation target, but it’s not happening yet. My explanation of this mystery is there is a kind of structural reform going on. The seniority-based wage system, whereby employees’ wages in Japan rise rapidly with their age is not sustainable with the aging of the population,” says Yashiro, an adviser on labor economics to three prime ministers. Companies are thus trying to halt automatic salary raises for workers in their 40s and 50s, and increase pay for younger ones, with one largely offsetting the other in the averages, according to Yashiro.
Dean Yashiro kindly sent us his chart…
 This is good news for younger workers who need income to start families to have babies to overcome the disappearance of Japan’s population pyramid.
For policy makers seeking to achieve an economic gold medal at the 2020 Olympic games in Tokyo, this means:
- Given need for babies, push forward with Prime Minister Abe’s initiatives on working conditions, women and family formation
- Given strength in income and consumption, time for the Bank of Japan to shift to its next phase – reducing QE in favor of PM Abe’s more powerful structural reforms
- Given high and growing household debt levels, pursue plans to reduce debt to avoid that debt crushing the recovery
To learn more about how to apply these insights to your professional portfolio, business or policy initiative, contact “editor” at this URL.
Data Geek Notes:
- Broad personal income, and Wages and Salaries are from the annual report with data through 1Q2016, deflated with Final Consumption Expenditures of Households.
- COE is from the quarterly report with data through 2Q2017, deflated with Final Consumption Expenditures of Households, excluding imputed rent and Financial Intermediation Services Indirectly Measured (FISIM)
- Japan’s “official” CPI reports higher price level increase than the household expenditure deflator for at least three reasons: 1) Single person households that purchase more consumer electronics and scalable services with more steeply falling prices are excluded from CPI, but included in the household deflator, 2) the mix of products purchased are updated every five years for the official CPI, but every quarter for the household deflator (a supplementary index is published that adjusts each period) and 3) deflators can be revised with more complete information whereas CPI is not. Japan’s CPI and U.S. CPI are calculated somewhat differently.
- Average personal income measures using either total population or labor force are about the same as aggregate because both have been roughly flat since 1995.

