Traders are hitting the panic button due to weak corporate sales. Yes, sales are down. But, traders are missing the more troubling longer term trend. Adjusting for prices and exchange rates, traders should panic less, but investors should be more concerned.
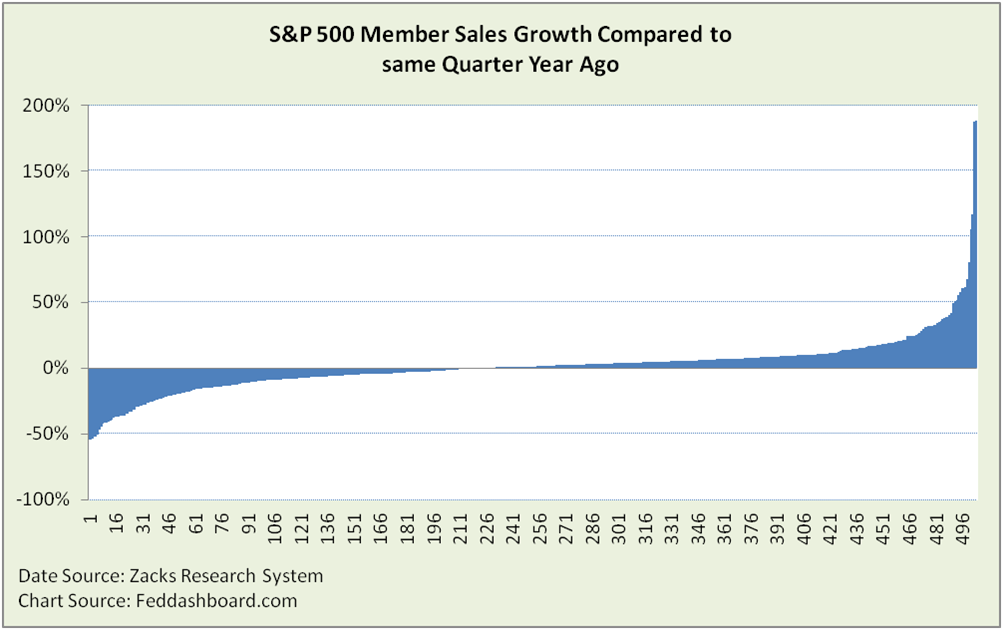
Today, about half of S&P 500 CEOs are captaining “sales submarines” – companies with real (price level-adjusted) sales decreases (quarter over year prior quarter). It was a shock to those who heard it recently and spurred a defensive trading reaction. But, should it have been a shock and what does it really mean?
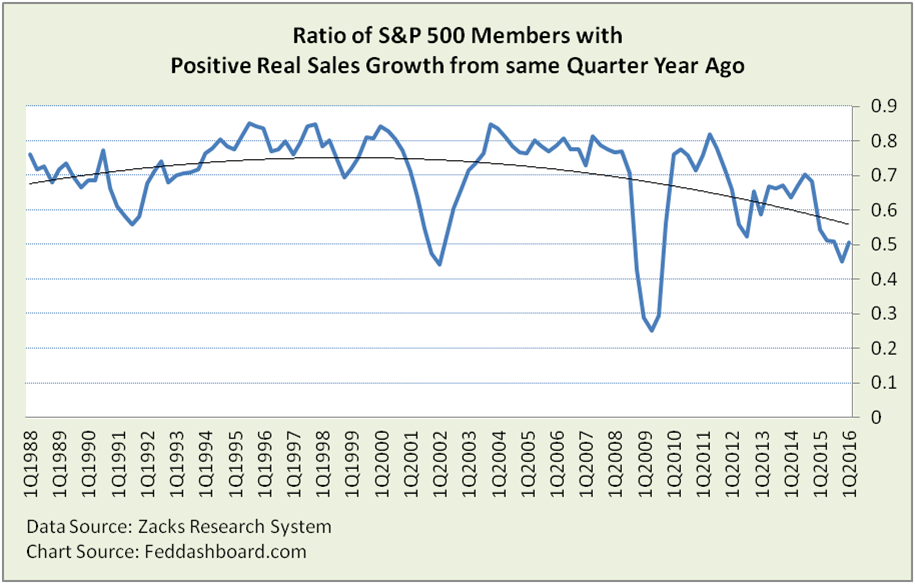
No, it should not have been a shock. Fundamental investors have been watching a downtrend since the double-dip of the tech bubble crash followed by the 2001 downturn. Anecdotally, longer term investors have been troubled by the “CFOs in CEO clothing” syndrome that came in the wake of that double-dip. Back then, boards of directors seem to have rotated in “efficiency” CEOs and rotated out “growth” CEOs in reaction to the “profitless sales” of the tech bubble. Fifteen years later, boards are still fighting the last battle with the wrong soldiers.
With half of companies being “above water” today (picture above), how does this compare to history (picture below)? Not well. Using the drill-down in Zacks Research System, we can easily see about two-thirds of companies were above water from 2012-2014, down from about 80% from 1994 to 2008 and 2011.
2. Pleasant Surprise
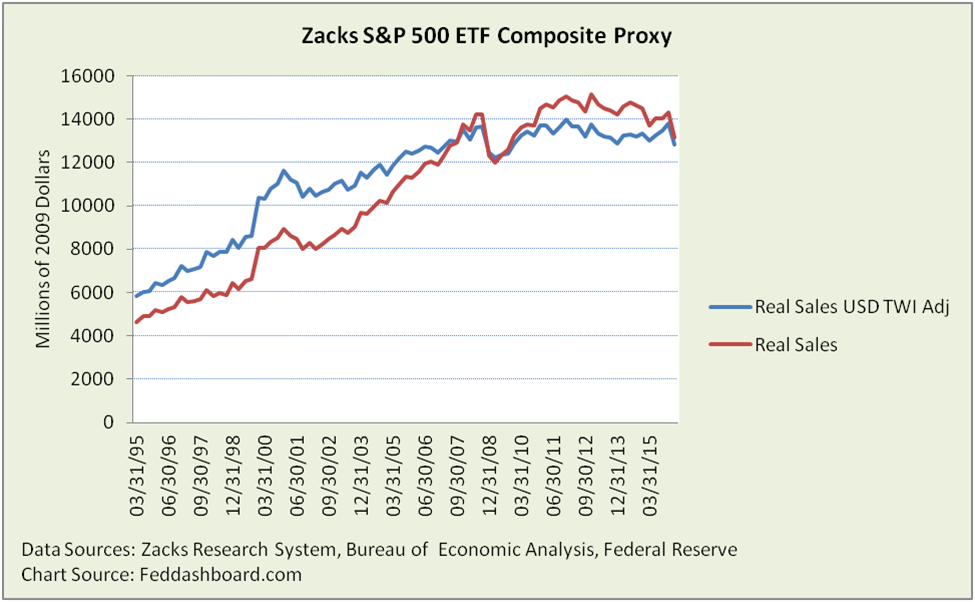
If current reporting holds, 1Q2016 will actually have a tiny bright spot. While aggregate average revenue is down (chart below), the percent of companies above water rose fractionally (chart above).
3. Fed Fear
As the U.S. Federal Reserve’s Large Scale Asset Purchases (a.k.a. Quantitative Easing or QE) tapered off in fall 2014, markets over-estimated interest rate “lift-off,” pushing the U.S. Dollar to new highs. We discussed this previously in, “Lift-off Lightheadedness.” This did damage to corporate sales in USD, but exactly how much is unclear due to data limitations. Can the effect be estimated? With CAUTION, we can try.
In “Avoid being mislead by quarterly results, ask five questions” we explored this under two ASSUMPTIONS:
- Fifty percent of S&P member sales are international. This follows the trend reported in the S&P 500® 2014: Global Sales Report (released July 2015). But, S&P noted that over half of companies didn’t separately state foreign sales. So, it’s a BIG assumption that reporting companies reflect all companies.
- Sales by country mirror overall U.S. trade patterns so that the sales could be adjusted with the U.S. Dollar Trade Weighted Index (Broad).
Another ASSUMPTION is that trends in 1Q2016 quarterly results hold.
 IF AND ONLY IF these ASSUMPTIONS are accurate, then the 1Q2016 drop takes real, FX-adjusted sales back to levels of 1Q2015, 4Q2013 and early 2007. Bright spot, the current drop is less than in 1Q2015. Of course, the less the actual foreign sales, the more the adjusted (blue) line would track the red line.
Take Action
- Fascinating drill down opportunities are created for fundamental fans to help pick the right stocks. Of course, then adjust for other changes such as mergers & divestitures and company product prices.
- The point is that investors who are blind to this data will also be blind to the need to look further – and opportunity. Don’t be blind.
Bottom Line
- Most troubling is roughly flat sales since 2007. Investors and companies are both running out of tricks to compensate. Step 1 for investors, boards and company managers is to recognize the magnitude of the problem.
- Company managers can take a fresh look at opportunities in light of market analysis, “research-to-retail” product costs, consumption patterns and business models. Then, improve management of risk to accept more initiatives with positive net present and/or options value.
- Traders can benefit by better tuning into fundamental trends.
- Investors can pick stocks on the “growth” side of the top chart using the 4Rs of business model-based investing.
Data Geek Notes:
- Sales in top two charts are from ZRS DBDQ database, Restated Items, R-Sales, extracted via Zacks Screener
- Sales in bottom chart are from S&P 500 ETF Composite Proxy, including company restated filings, shown as averages, extracted from ZRS DBDQ database via Zacks Link
- Sales are adjusted for price level changes with GDP deflator.


