“Real GDP up 3.2%” shouted the headlines — the traders (and politicos) were off to the races. For investors, headlines hold little value – and can be dangerous. Instead, details matter. In this GDP release, details about services, durable goods, and exports especially matter.
We start our myth-busting (or headline-busting) with the caution that this release is the “second” estimate. We described the revision process previously. Since then, the U.S. Bureau of Economic Analysis (BEA) has improved the timeliness of trade and inventory data.
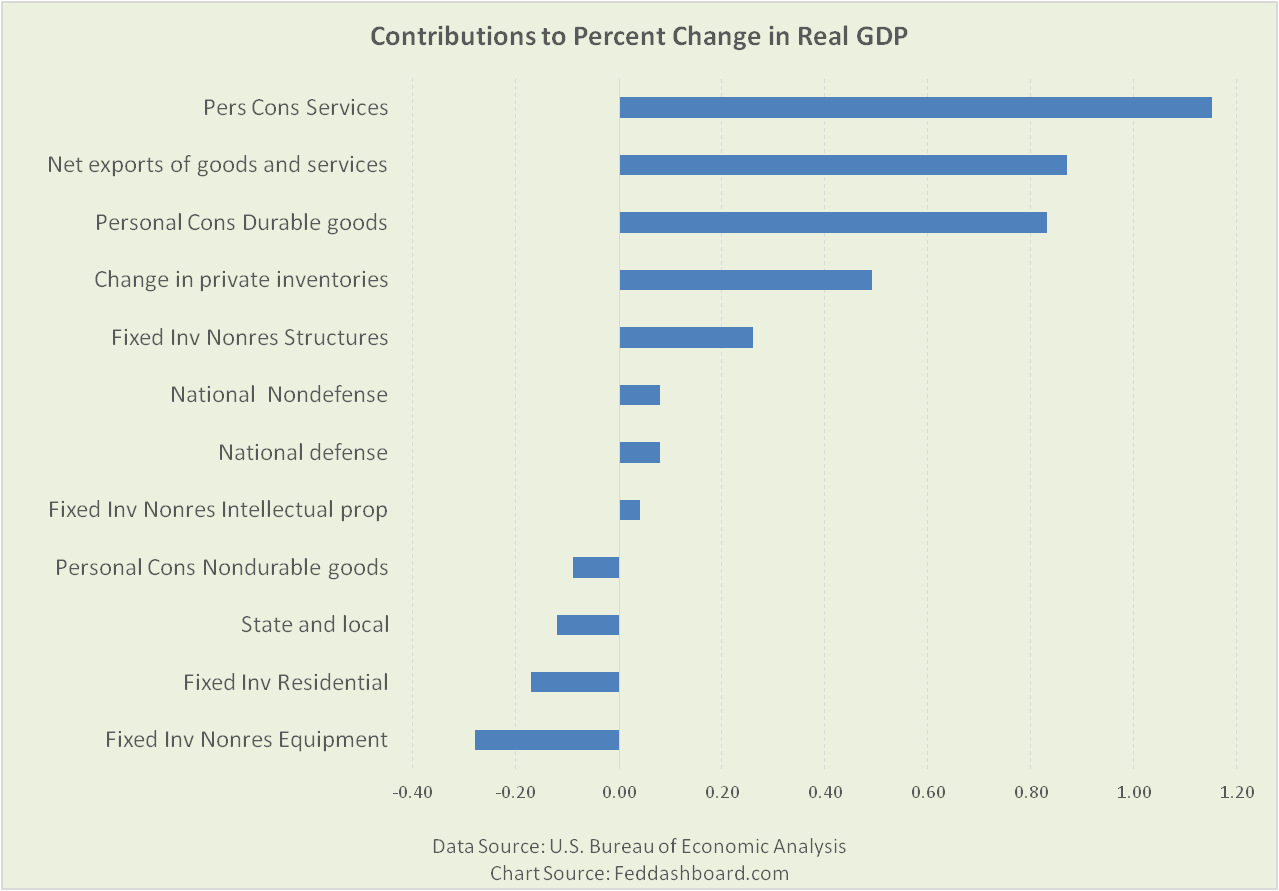
Thanks to the number crunchers at the BEA, we can see the contributions to percent change in Gross Domestic Product (GDP) – these add up to 3.2%.
 Contributions reflect both the real (price level-adjusted) growth and size of each category.
But, it would be wrong to think that growth was widespread across all services, exports or durable goods.
The reality is revealed by digging deeper. Which products led in real growth?
- In personal consumption of services, leaders were: motion picture theaters; securities commissions; passenger fares for foreign travel; expenditures by foreign students in the U.S.; and intercity bus fares.
- In exports, leaders were: Foods, feeds, and beverages; and industrial and consumer durables. Aircraft was slightly down, not a big mover this quarter.
- In personal consumption of durable goods, leaders were: automotive (led by light trucks) and consumer electronics.
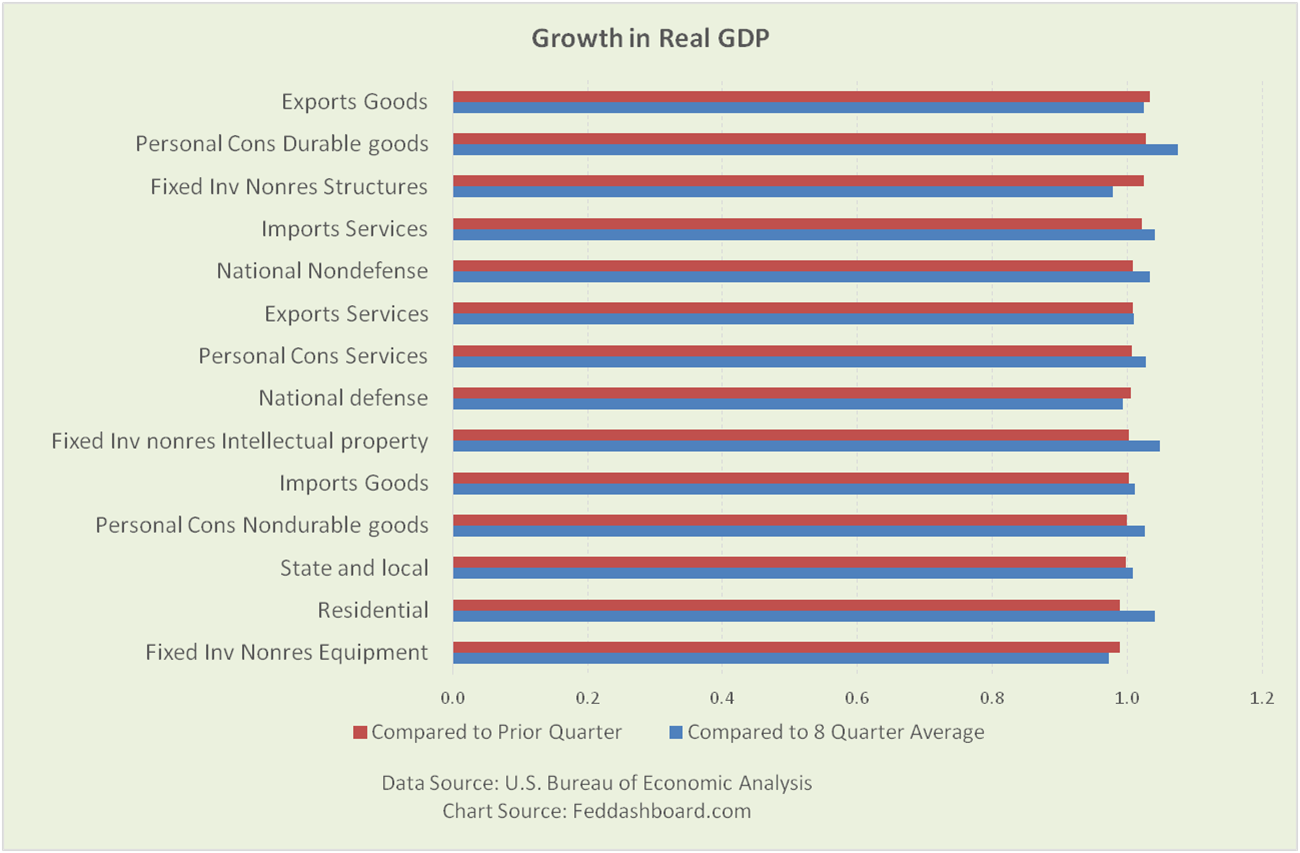
BUT, these are just changes from the prior quarter. It doesn’t tell a story over time. To see more, we can compare (with a ratio) this quarter change to the prior eight quarter average change.
 This reveals that:
- Personal consumption expenditures (all three categories) and residential investment growth were weaker than the prior eight-quarter average – in contrast to reading only the “contributions” view.
- Personal consumption durables (despite being lower this quarter than its prior average) is the only category to be up significantly over both the prior period and eight-quarter This isn’t surprising given that stronger consumption has been powered by falling prices for two decades as we’ve shown previously.
- Goods exports were stronger than their eight-quarter average, having rebounded from weakness that started in 4Q2014 and above their prior high
- Nonresidential structures had been contracting since 4Q2014, were up in 3Q2016 compared to prior quarter but still below their prior high
For traders, failing to see dramatic differences led to mistakes.
For industry investors, the BEA data is a treasure trove, including insights that motorcycles have continued their slide since a strong 3Q2015 and that prescription drugs had a rare negative quarter.
Bottom line:
- Bearish: 3Q2016 second estimate (with revisions yet to come) wasn’t as widely strong as headlines implied. Rather, growth was in specific areas.
- Bullish: With a view over time, our economy is making solid progress. Yet, it is dramatically restructuring. As we’ve written previously, the Federal Open Market Committee (FOMC) has missed much of this restructuring.
- Specific strengths and weaknesses in the data create specific opportunities for stock-pickers as we wrote in our series that opened 2016.
To learn more about how to apply these insights to your professional portfolio, business or policy initiative, contact “editor” at this URL.
Data Geek Note: Current period change can be compared to any prior range. Eight-periods happen to roughly coincide with when the FOMC ended their large scale asset purchases.

