
At year end, it’s tempting to buy a company with a “good news” story about dividends, earnings or price. But, that would be wrong. Why? “Headline” numbers are too easily manipulated. To gain advantage from superior insight, check the interplay of shares outstanding, cap ex and debt.
Share buybacks are high on the list to check because they can distort financial ratios and hide real growth problems. But, buybacks are just part of the story. To spot opportunity, investors need to understand buybacks relative to factors such as debt and capital expenditures (a.k.a., cap ex, or property, plant, and equipment). Failing to check means that screening ratios will be set in error, companies compared inappropriately and portfolios will underperform.
For S&P500 member companies (using Zacks Research System (ZRS) to provide an “apples-to-apples” historical view), we can see the percentage change from a year ago in shares outstanding, total debt and cap ex.
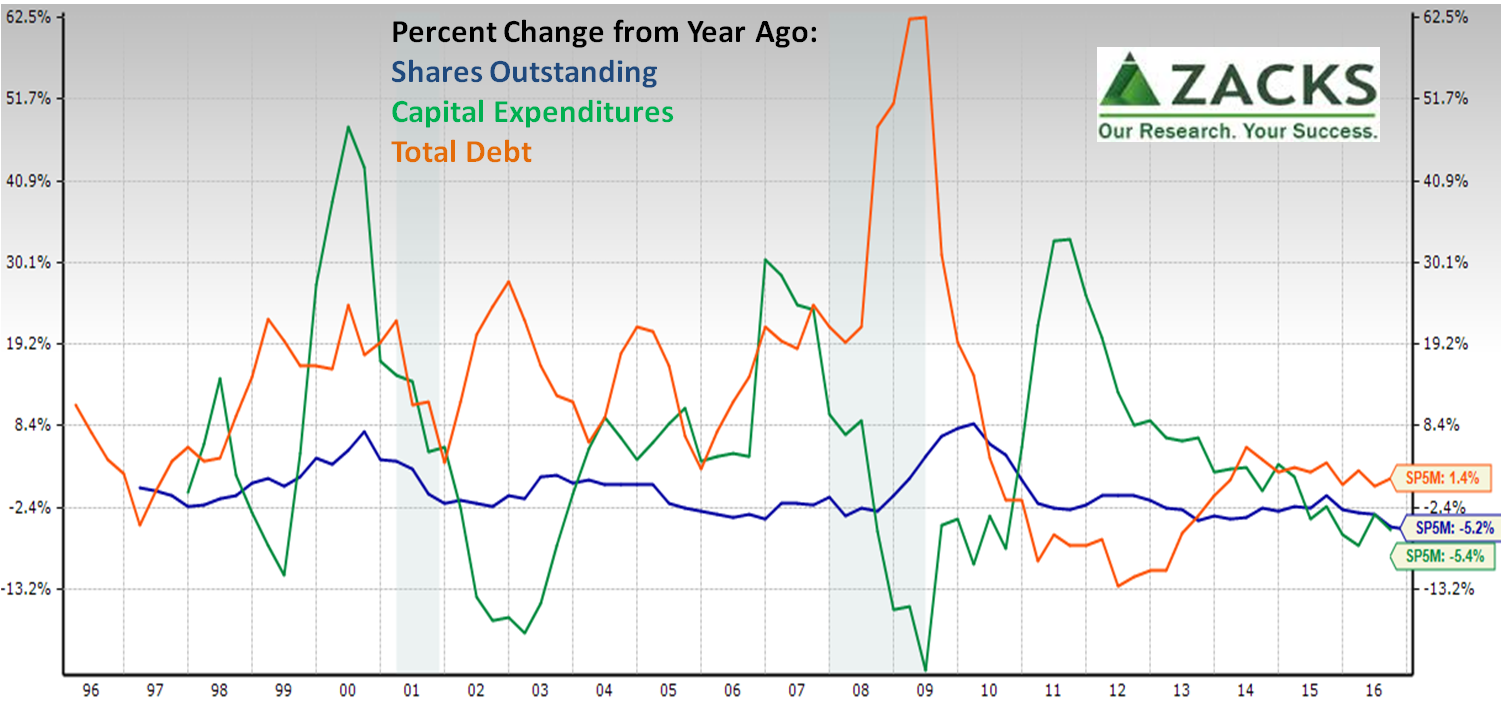 Change in shares outstanding has often been negative, more in the past year. While share buybacks are theoretically neutral because of the cash used for the buybacks, the combination of the Federal Open Market Committee creating a bubble and then stock funds seeking to pad their returns by bidding up prices have created a bubble of historic proportions as we’ve shown before, and distortions in price/earnings ratios and earnings per share.
Percentage change in cap ex has been decreasing since 2011 and total debt since mid-2014. We’ve illuminated both before…
- Cap ex is falling because both it takes less cap ex to produce output than it did in the past and companies adverse to risk have been rejecting projects with positive net present value that could grow sales.
- Total debt falling could be due to either balance sheet engineering or business model strategy.
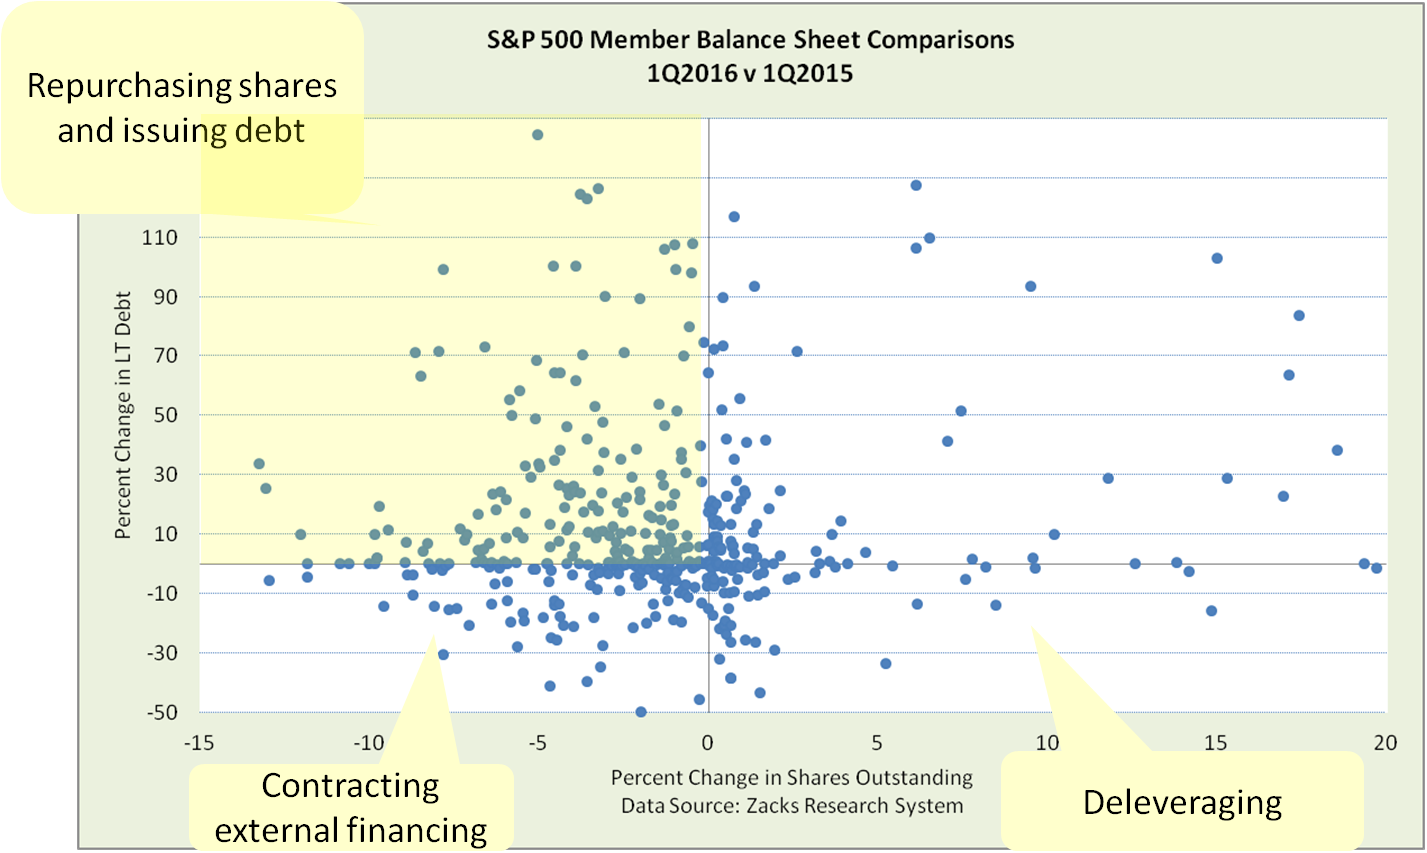
Better investing requires looking at sources and uses of funds in individual companies, not just index averages. With ZRS, we can see individual companies.
This picture shows the typical news story of bad actor companies swapping equity for debt misses the bigger story. Yes, most companies with buybacks are generally increasing credit risk and dressing-up per share items. But, other companies are taking different actions — deleveraging, cutting all external financing or growing both. Look closely at each. For example, cutting external financing might be because a company is contracting or because it is a cash generation powerhouse.
 Given changes in shares, how are companies changing cap ex (PPE)? Again, in four different ways…
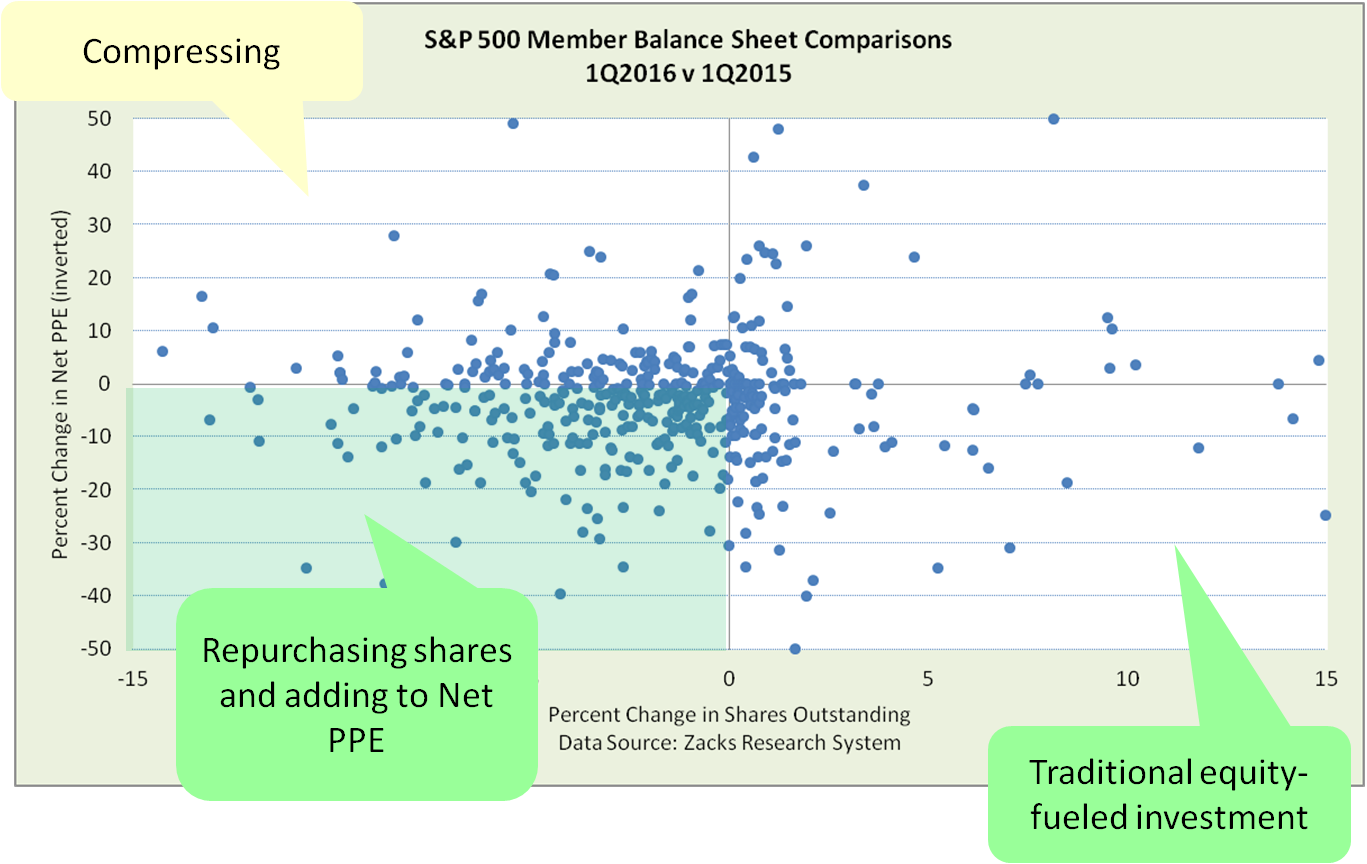 There are more ways to evaluate the quality of a business model by drilling down with this data, and then comparing to sales and cash flow in view of business strategy and environment. As always, environment evaluation includes political, social, technology and other changes.
Does this mean that buybacks are always bad? No, companies such as cash-rich digitals or those in declining spaces without room to grow often need to return cash. The question is the best way to return cash given investor portfolio design and tax situations. That might be buybacks. Yet, that doesn’t change the need to avoid mistakes by viewing company ratios in the context of buybacks.
The point is that headline numbers hide tangible company actions and business model quality.
To evaluate stock picks more clearly; investors can also…
- Ask 5 questions about quarterly releases to avoid being a victim of company earnings engineering: Units sold, product cost dynamics, PPE use, risks in the discount rate and what business announcements in advance of earnings releases might be hiding.
- Probe bubbles short and longer term – Bubbles are not easy to see in price data alone. Bubbles are easier to see when compared to tangible measures such as assets, sales, and cash flow.
Bottom line to improve your performance: in automated screening, adjust ratios; and in manual evaluation, probe interplay of measures.
To learn more about how to apply these insights to your professional portfolio, business or policy initiative, contact “editor” at this URL.
Data Geek Notes:
- For the “apples to apples” view, use the “SP5M” in Zacks composites
- For the scatter plots, extract the data via Zacks Screener