
29 May 2014
Digging behind the numbers in “Measures to know of healthy jobs and paychecks” (April 23, 2014) aspired to clarify several points, including:
- U-3 unemployment rate (Official) does not consistently track with U-6 unemployment rate (Total unemployed, plus all persons marginally attached to the labor force, plus total employed part time for economic reasons)
- Job quality (in terms of total hours, skill level, permanence and wages) matters. A job lost in a long term health care facility is not fully recovered by a home health care worker and a job in hospitality does not equal a job in high-skill manufacturing.
- A “pocketbook” measure is Real Wages and Salaries per working age person (adjusting for inflation with Consumer Price Index for All Urban Consumers). It’s personal. It touches people’s paychecks. This view revealed average real paychecks on another plateau since 1999, modestly growing from 2010 back up to 1999 levels.
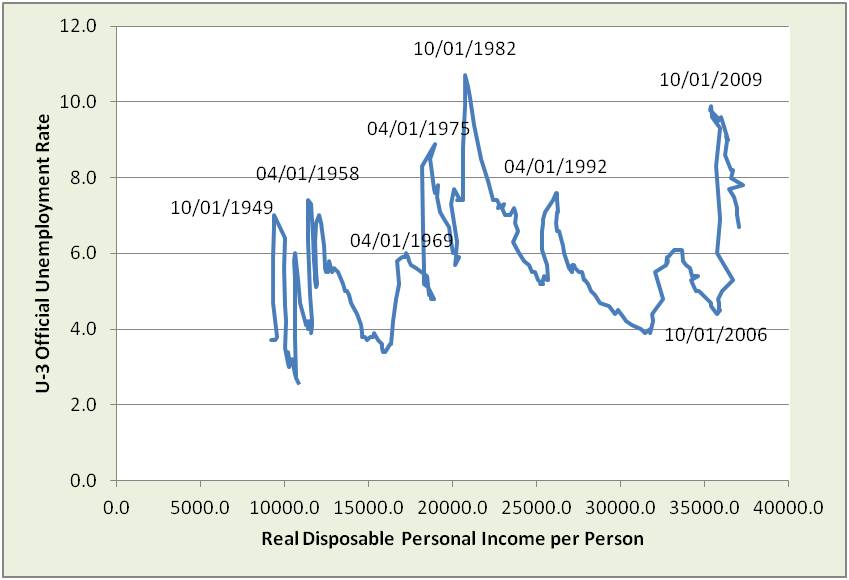
The Unemployment-Income curve brings together both the job count and dollar views in a picture of the changing relationship over time between the U-3 official unemployment rate and real (inflation-adjusted) Disposable Personal Income (income minus income taxes) per person.
Reductions in the official unemployment rate haven’t been associated with so little real Disposable Personal Income (DPI) per person growth since the 1950s.
- Substantively, this echoes concern about poor quality job recovery.
- Measurement-wise, because U-3 and real DPI per person do not have a stable association, U-3 is not a good overall indicator of this aspect of job market health.
In economic health terms, Real Wages & Salaries (as opposed to employment counts, or hourly or weekly earnings) in total is powerful because of how it helps or hurts the cycle of consumption that feeds business sales, that feeds wages and salaries, that feeds consumption that feed business sales, and so on.
 Reasons for falling back into the “frozen fifties” are discussed in the Economic Picture Book.
One of these – global wage and capacity pressures – is discussed in the “6 dots to help you tell the story of US imports and job pressures” (15 April 2014)
The unemployment-income curve helpfully makes clear that:
- Broader measures of job market health are needed for better decisions in policy and investments
- In our current situation, the pocketbook measure is especially important
Note:
- Real DPI is disposable personal income adjusted to constant dollars by the implicit price deflator for personal consumption expenditures (chained 1996 dollars).
- Population is the total population of the United States (including armed forces overseas and institutional). Both are used by the Bureau of Economic Analysis (BEA) in its calculation of Real DPI per capital in Series A229RX in NIPA Section 2 (Tab 209 Month.)